Back

Initial Velocity quiz

Control buttons has been changed to "navigation" mode.
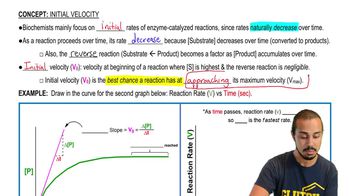
1/15
  • Why do biochemists focus on initial reaction velocities (v0) in enzyme-catalyzed reactions?

    Initial velocities provide the best approximation of maximum velocity (vmax) before significant product formation and reverse reactions occur.
  • What happens to substrate concentration as an enzyme-catalyzed reaction proceeds over time?

    Substrate concentration decreases over time because substrate is converted into product.
  • How does substrate concentration affect reaction rate in enzyme-catalyzed reactions?

    Higher substrate concentration correlates with higher reaction rate, while lower substrate concentration correlates with lower reaction rate.
  • Why is the reverse reaction negligible at the very beginning of an enzyme-catalyzed reaction?

    At the start, product concentration is negligible, so the reverse reaction from product to substrate is minimal.
  • What does the initial velocity (v0) represent in enzyme kinetics?

    It represents the reaction velocity at the very beginning of the reaction, when substrate concentration is highest and product concentration is negligible.
  • Can enzymes attain their maximum velocity (vmax)?

    Enzymes cannot attain vmax; they can only approach it, especially at high substrate concentrations.
  • How is the initial reaction rate determined from a product vs. time graph?

    It is determined by the slope of the tangent line at the very beginning of the curve, where time is close to zero.
  • What happens to the reaction rate of an enzyme-catalyzed reaction as time progresses?

    The reaction rate decreases over time due to substrate depletion and product accumulation.
  • Why are enzyme kinetics plots important for measuring initial reaction velocities?

    They plot v0 against varying substrate concentrations, allowing comparison of initial velocities under consistent conditions.
  • What is plotted on the x-axis and y-axis of an enzyme kinetics plot?

    The x-axis shows substrate concentration, and the y-axis shows initial reaction velocity (v0).
  • Why can't time be on the x-axis of an enzyme kinetics plot measuring initial velocity?

    Because initial velocity only occurs at the very beginning of the reaction, and monitoring over time would not reflect v0.
  • What does the leveling off of the curve in an enzyme kinetics plot indicate?

    It indicates enzyme saturation, where increasing substrate concentration no longer increases the reaction rate.
  • Why are data points in enzyme kinetics plots from separate experiments?

    Each data point represents a different initial substrate concentration, measured in separate experiments to ensure consistent conditions.
  • How does the reaction rate after 30 seconds compare to the initial reaction rate at the same substrate concentration?

    The reaction rate after 30 seconds is lower than the initial reaction rate for the same substrate concentration.
  • Why must variables like temperature, pH, and enzyme concentration remain constant in enzyme kinetics experiments?

    Keeping these variables constant ensures that differences in reaction rates are due to substrate concentration, allowing valid comparisons.