 Back
BackComprehensive Study Notes for College Biology: Genetics, Evolution, Plant Biology, and Ecology
Study Guide - Smart Notes
 Tailored notes based on your materials, expanded with key definitions, examples, and context.
Mendelian Genetics and Molecular Genetics
Gene Locus, Homologous Pairs, and Meiosis
The gene locus is the specific location of a gene on a chromosome. In diploid organisms, each gene locus is present in two copies—one on each chromosome of a homologous pair (one maternal, one paternal). During meiosis I, homologous chromosomes (and thus the two copies of each locus) separate into different daughter cells. After meiosis II, each gamete contains just one copy of each locus.
Genotype, Phenotype, and Modes of Inheritance
Genotype: The genetic makeup (alleles) of an organism for a trait (e.g., BB, Bb, or bb).
Phenotype: The observable trait resulting from the genotype and environment (e.g., brown or blue eyes).
Modes of Inheritance: Rules connecting genotype to phenotype, including:
Mendelian (dominant–recessive): Dominant allele masks recessive (Bb shows dominant trait).
Incomplete dominance: Heterozygote shows intermediate phenotype (e.g., pink flowers from red and white alleles).
Codominance: Both alleles fully expressed (e.g., AB blood type).
Sex-linked inheritance: Genes on sex chromosomes affect males and females differently (e.g., X-linked color blindness).
Polygenic inheritance: Multiple genes contribute to a single phenotype (e.g., height).
Genetic Linkage, Crossing Over, and Recombination Frequency
Genetic linkage occurs when genes are close together on the same chromosome and tend to be inherited together. Crossing over during prophase I of meiosis can separate linked genes, producing recombinant gametes. The recombination frequency (percentage of recombinant offspring) reflects the genetic distance between genes: the farther apart, the higher the frequency. One map unit (centimorgan) equals 1% recombination frequency.
DNA Structure and Replication
DNA nucleotide: Phosphate group, deoxyribose sugar, and a nitrogenous base (A, T, G, C). The base varies; the sugar and phosphate are uniform.
Double helix: Two strands held together by hydrogen bonds (A–T, G–C), running antiparallel (5'→3' and 3'→5').
Replication: DNA polymerases synthesize new DNA only in the 5'→3' direction. The leading strand is synthesized continuously; the lagging strand is synthesized in Okazaki fragments, each starting with an RNA primer.
Central Dogma and Gene Expression
Central Dogma: DNA → RNA → Protein
Transcription: DNA is transcribed to mRNA in the nucleus by RNA polymerase II, using transcription factors and promoter sequences (e.g., TATA box).
Translation: mRNA is translated into protein at ribosomes in the cytoplasm. tRNAs bring amino acids, matching mRNA codons with anticodons.
Mutations: Point mutations (silent, missense, nonsense) and insertions/deletions (frameshift if not a multiple of three) can alter protein sequences.
Evolution and Speciation
Darwinian Evolution and Evidence
Descent with modification: Species arise from ancestral species, accumulating differences over time.
Natural selection: Individuals with advantageous traits leave more offspring, increasing those traits in the population.
Evidence: Direct observation, homology (shared ancestry), fossil record, biogeography, and molecular biology (shared genetic code).
Speciation and Reproductive Isolation
Allopatric speciation: Geographic isolation leads to divergence and formation of new species.
Prezygotic barriers: Prevent mating or fertilization (habitat, temporal, behavioral, mechanical, gametic isolation).
Postzygotic barriers: Prevent hybrid offspring from developing into viable, fertile adults.
Plant Structure, Growth, and Development
Plant Organs and Tissue Types
Roots: Anchor plant, absorb water/minerals, store carbohydrates.
Shoots (stems, leaves, flowers): Support, photosynthesis, reproduction.
Leaves: Main site of photosynthesis, gas exchange via stomata.
Dermal tissue: Outer protective covering (epidermis, cuticle, root hairs).
Vascular tissue: Transport (xylem for water/minerals, phloem for sugars).
Ground tissue: Storage, photosynthesis, support (cortex, pith, mesophyll).
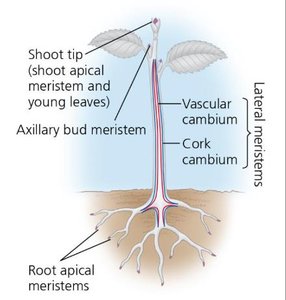
Meristems and Plant Growth
Apical meristems: At root and shoot tips; responsible for primary (lengthwise) growth.
Axillary meristems: At leaf bases; form branches or flowers.
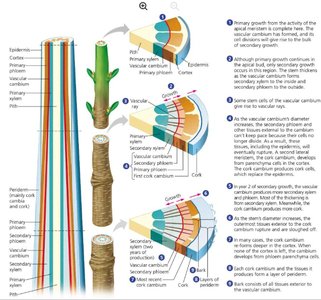
Vascular cambium: Lateral meristem producing secondary xylem (wood) and phloem (thickening stems/roots).
Cork cambium: Lateral meristem producing cork (protective outer layer).
Turgor Pressure and Water Movement
Turgid cell: Plant cell full of water, providing structural support (especially in non-woody plants).
Transpiration: Evaporation of water from leaves creates negative pressure, pulling water up through xylem (cohesion and adhesion of water molecules).
Guard cells: Regulate stomatal opening/closing, balancing CO₂ uptake and water loss.
Ecology: Populations, Communities, and Ecosystems
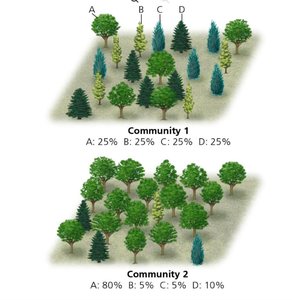
Biodiversity: Species Richness and Relative Abundance
Biodiversity includes species richness (number of species) and relative abundance (proportion of each species). Communities with even abundance are more diverse than those dominated by one species.
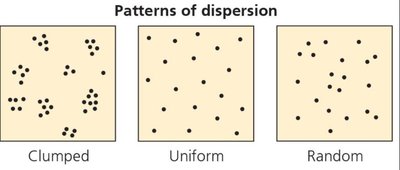
Population Dispersion Patterns
Clumped: Individuals aggregate in patches (most common; resource-based).
Uniform: Even spacing, often due to territoriality or competition.
Random: Unpredictable spacing, rare in nature.
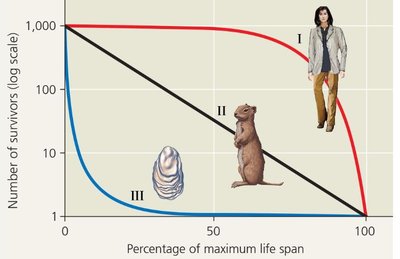
Survivorship Curves and Life History Strategies
Type I: Low mortality early, high late (e.g., humans).
Type II: Constant mortality (e.g., rodents).
Type III: High early mortality, low later (e.g., oysters).
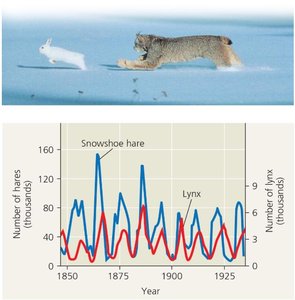
Predator-Prey Dynamics (Lotka-Volterra Model)
Predator and prey populations cycle: prey increase first, followed by predators. As predators rise, prey decline, then predator numbers fall, allowing prey to recover.
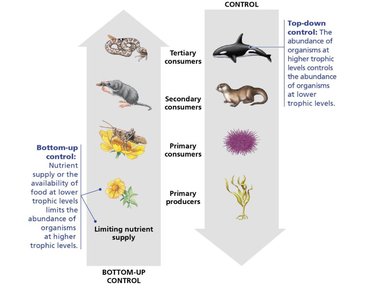
Top-Down vs. Bottom-Up Regulation
Bottom-up: Resource availability controls higher trophic levels.
Top-down: Predators control abundance of lower trophic levels.
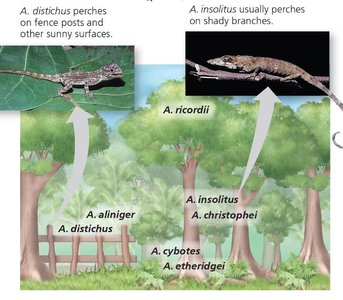
Resource Partitioning and Ecological Niches
Resource partitioning allows similar species to coexist by using different resources or habitats, reducing direct competition. The ecological niche is the sum of a species' use of biotic and abiotic resources. The fundamental niche is the full potential range; the realized niche is what is actually occupied due to competition.
Succession in Communities
Succession is the sequence of species colonization and replacement after disturbance. Primary succession starts on bare substrate; secondary succession occurs where soil remains.
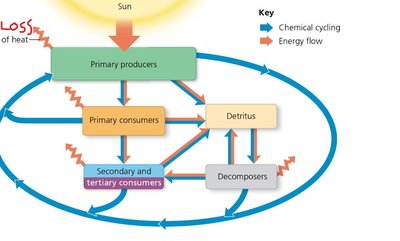
Energy Flow and Nutrient Cycling in Ecosystems
Energy flow: Sun → producers → consumers → decomposers; energy lost as heat at each step.
Chemical cycling: Elements (C, N, P, H₂O) cycle between biotic and abiotic components.
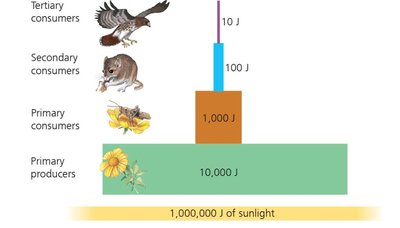
Trophic Levels and Energy Pyramids
Primary producers: Plants, algae (autotrophs).
Primary consumers: Herbivores.
Secondary/tertiary consumers: Carnivores.
Decomposers: Break down dead material, recycle nutrients.
Only ~10% of energy transfers to the next level, limiting food chain length.

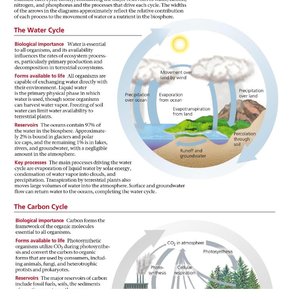
Biogeochemical Cycles
Water cycle: Evaporation, condensation, precipitation, transpiration, runoff.
Carbon cycle: Photosynthesis, respiration, decomposition, fossil fuel burning.
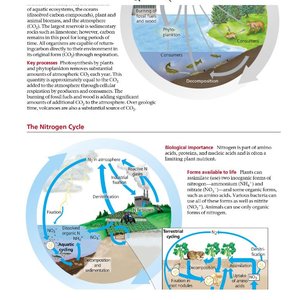
Nitrogen cycle: Nitrogen fixation, nitrification, assimilation, denitrification.
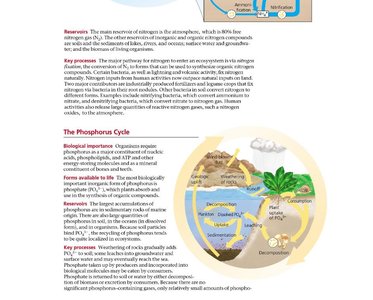
Phosphorus cycle: Weathering of rocks, uptake by organisms, decomposition, sedimentation.
Global Change and Ecosystem Dynamics
Global change (e.g., climate change) alters temperature, precipitation, and disturbance regimes, shifting species distributions, changing community composition, and affecting energy flow and nutrient cycling. Species must adapt, migrate, or face decline if their realized niches disappear.
Additional info: These notes synthesize and expand upon the provided study guide, integrating textbook-level explanations, definitions, and examples for comprehensive exam preparation.
