

18. Aqueous Equilibrium
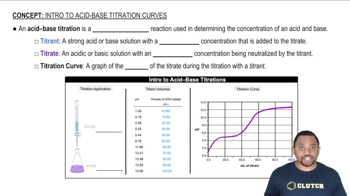
Intro to Acid-Base Titration Curves

Get help from an AI Tutor
Ask a question to get started.
Problem 61a
Textbook Question
Textbook QuestionThe graphs labeled (a) and (b) show the titration curves for two equal-volume samples of monoprotic acids, one weak and one strong. Both titrations were carried out with the same concentration of strong base. (a) (b) (i) What is the approximate pH at the equivalence point of each curve?
 Verified Solution
This video solution was recommended by our tutors as helpful for the problem above
Video duration:
4m601
views
Was this helpful?
Related Videos
Related Practice
 03:04
03:04


Showing 1 of 11 videos