

18. Aqueous Equilibrium
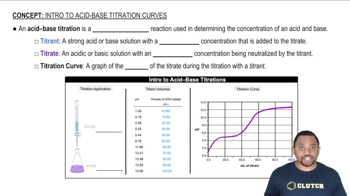
Intro to Acid-Base Titration Curves

Get help from an AI Tutor
Ask a question to get started.
Problem 5
Textbook Question
Textbook QuestionThe following figure represents solutions at various stages of the titration of a weak acid, HA, with NaOH. (The Na+ ions and water molecules have been omitted for clarity.) To which of the following regions of the titration curve does each drawing correspond: (b) after addition of NaOH but before the equivalence point? [Section 17.3]

 Verified Solution
This video solution was recommended by our tutors as helpful for the problem above
Video duration:
2m978
views
Was this helpful?
Related Videos
Related Practice
 03:04
03:04


Showing 1 of 11 videos