Skip to main content
Microeconomics
My Course
Learn
Exam Prep
AI Tutor
Study Guides
Flashcards
Explore
Try the app
My Course
Learn
Exam Prep
AI Tutor
Study Guides
Flashcards
Explore
Try the app
Back
Supply and Demand: Quantitative Analysis definitions
You can tap to flip the card.
Equilibrium
You can tap to flip the card.
👆
Equilibrium
Occurs where market quantity supplied matches quantity demanded, both algebraically and graphically at the intersection of supply and demand curves.
Track progress
Control buttons has been changed to "navigation" mode.
1/15
Related flashcards
Related practice
Recommended videos
Supply and Demand: Quantitative Analysis quiz #1
Supply and Demand: Quantitative Analysis
24 Terms
Effects of Shortage
3. The Market Forces of Supply and Demand
10 problems
Topic
3. The Market Forces of Supply and Demand
11 topics
15 problems
Chapter
Guided course
05:11
Finding Equilibrium Using Algebra
2806
views
11
rank
Guided course
03:57
Isolating Variables in the Demand Equation
2884
views
24
rank
1
comments
Guided course
07:22
Finding Equilibrium with Equations and a Graph
2627
views
33
rank
Terms in this set (15)
Hide definitions
Equilibrium
Occurs where market quantity supplied matches quantity demanded, both algebraically and graphically at the intersection of supply and demand curves.
Demand Curve
Represents the relationship between price and quantity demanded, typically plotted as a downward-sloping line using a linear equation.
Supply Curve
Shows how price relates to quantity supplied, often graphed as an upward-sloping line derived from a linear equation.
Quantity Demanded
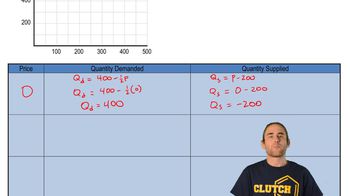
Refers to the amount consumers are willing to purchase at a specific price, calculated by substituting price into the demand equation.
Quantity Supplied
Indicates the amount producers are willing to offer at a certain price, found by plugging price into the supply equation.
Price Axis
Vertical axis on a graph where different price levels are marked, used to plot supply and demand points.
Quantity Axis
Horizontal axis on a graph displaying various quantities, essential for plotting supply and demand curves.
Intersection
Graphical point where supply and demand curves cross, visually identifying market equilibrium.
Linear Equation
Mathematical expression with variables and constants forming a straight line, used for supply and demand relationships.
Variable Isolation
Algebraic process of rearranging equations so one variable stands alone, facilitating easier calculation of price or quantity.
Coefficient
Numerical factor multiplying a variable in an equation, affecting the slope of supply or demand curves.
Slope
Measures the steepness of a curve, determined by the coefficient in supply or demand equations.
Equilibrium Price
Market price at which quantity supplied equals quantity demanded, found by solving supply and demand equations.
Equilibrium Quantity
Market quantity where supply matches demand, calculated by setting supply and demand equations equal.
Graphical Representation
Visual depiction of supply and demand curves on axes, used to illustrate equilibrium and market behavior.
 BackBack
 05:11
05:11