

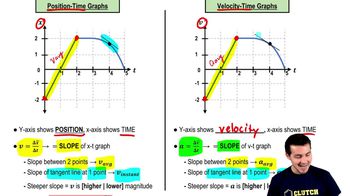
2. 1D Motion / Kinematics
Velocity-Time Graphs & Acceleration
Problem 2g
Textbook Question
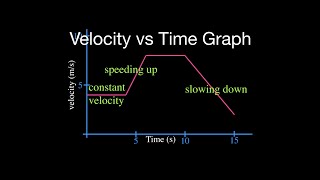
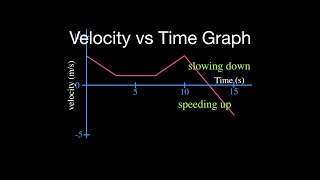
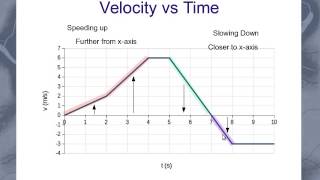
Textbook QuestionA ball moves in a straight line (the x-axis). The graph in Fig. E2.9 shows this ball's velocity as a function of time. (a) What are the ball's average speed and average velocity during the first 3.0 s?


 Verified Solution
This video solution was recommended by our tutors as helpful for the problem above
Video duration:
7m2069
views
Was this helpful?
Related Videos
Related Practice
 05:59
05:59


Showing 1 of 7 videos