- Download the worksheet to save time writing
- Start solving the practice problems
- If you're stuck, watch the video solutions
- See your summary to get more insights

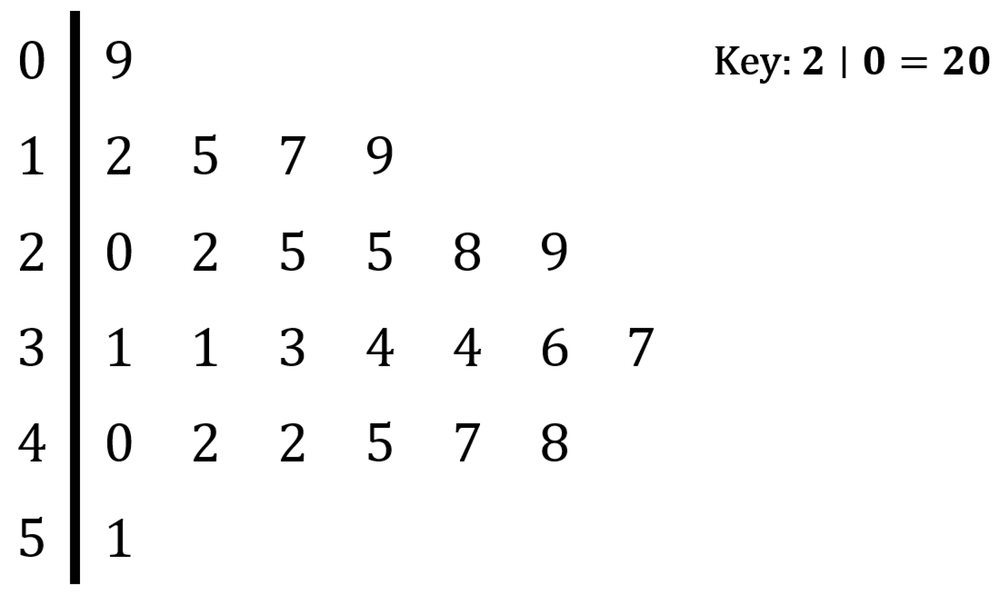
The following stem-and-leaf plot shows the ages (in years) of participants in a community workshop. Find the mean, median, and mode of the data, if possible. If any measure cannot be found or does not represent the center of the data, explain why.
Which of the following data sets has no mode?
A group of hikers recorded the distance they covered during a week. The recorded data (in kilometers) is as follows:
Compare the four measures of central tendency (mean, median, mode, and midrange) for the original data set and the trimmed data set.
Use the data below to calculate the mean, median, and mode of daily screen time. Then, determine whether each measure appropriately represents the central tendency of the data. If any measure is not applicable or does not accurately reflect the data's center, explain why.
Daily screen time (in hours) recorded for a sample of high school students:
, , , , , , , , , , , , ,
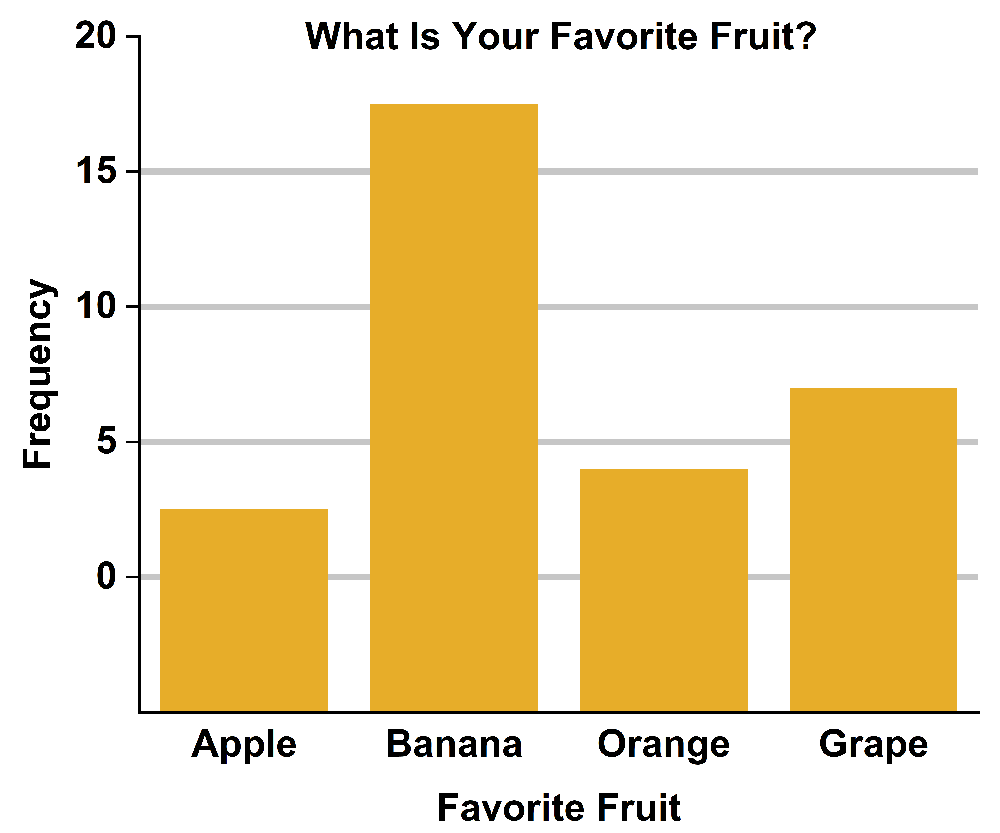
Based on the given graph, which measure of central tendency best represents the data?
The following are the weekly paychecks in dollars for part-time tutors:
, , , , , , , , , , , , , , , .
Determine the mean, median, and mode of these paychecks. Which value best represents a typical weekly paycheck?
Select the data set where the mean and median are the same, and the set is bimodal.
Listed below are the number of cars owned by a group of individuals.
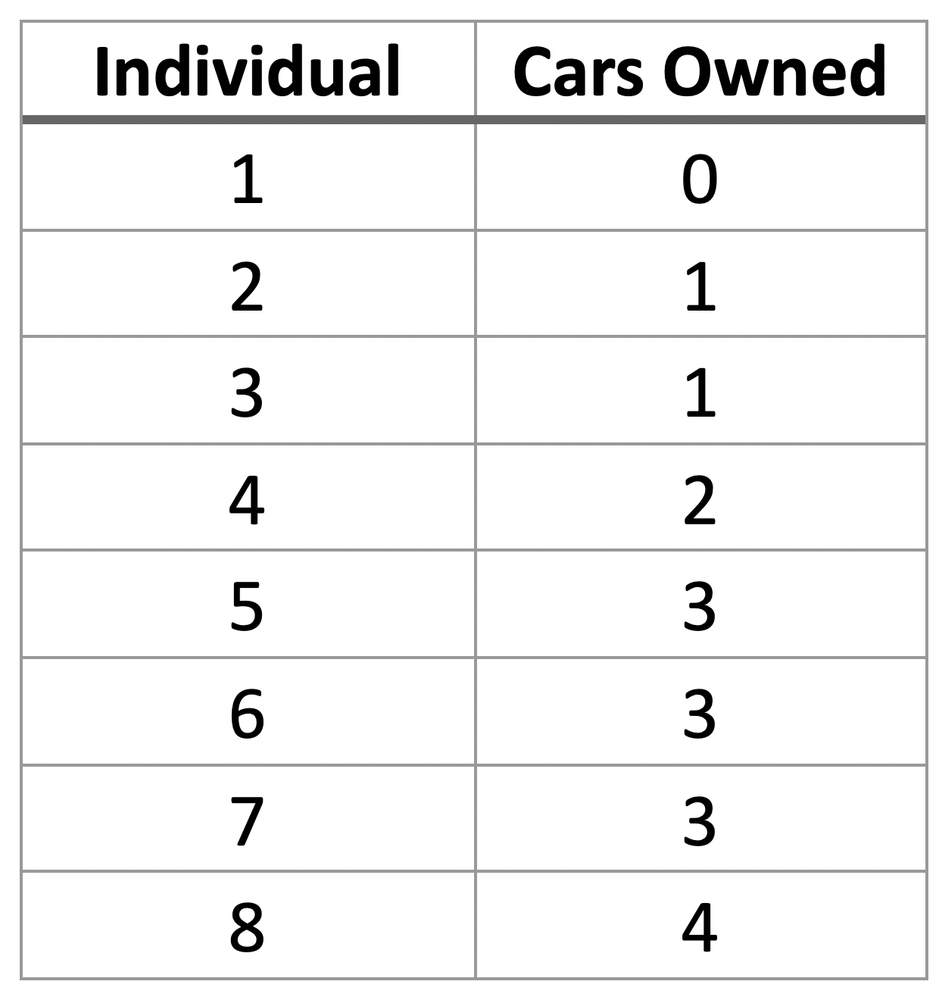
Find the mode and range.
Determine the mean, median, and mode of the data set, if applicable. If any of these measures cannot be calculated or fail to accurately represent the data’s central tendency, provide a brief explanation.
The durations (in minutes) of seven educational podcast episodes from an online learning platform are:
, , , , , ,
A zoologist recorded the primary habitat observed for a random sample of frogs. The observations are:
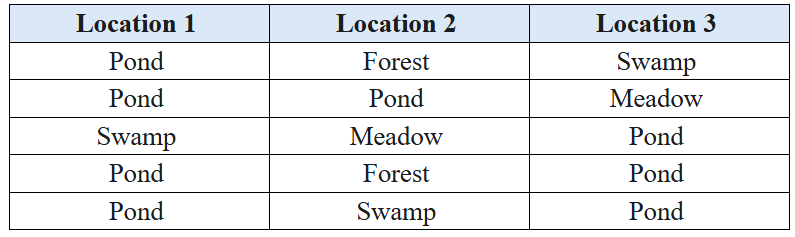
What is the modal habitat observed?