 Back
Ch 3 - Statistics for Business: Measures of Central Tendency, Variation, and Relative Position
 03:08

Terms in this set (20)
The three main measures of central tendency are mean, median, and mode.
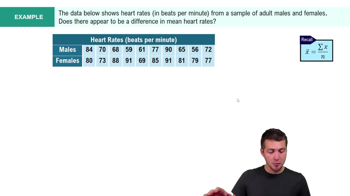
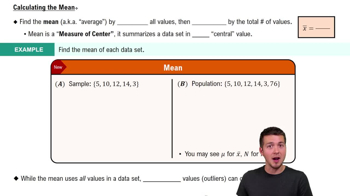
The mean is the arithmetic average, calculated by summing all values and dividing by the number of observations: \(\bar{x} = \frac{\sum x_i}{n}\).
The weighted mean assigns different weights to values, useful when some data points contribute more than others: \(\bar{x}_w = \frac{\sum w_i x_i}{\sum w_i}\).
If the number of observations n is odd, the median is the value at position \(\frac{n+1}{2}\). If n is even, it is the average of values at positions \(\frac{n}{2}\) and \(\frac{n}{2}+1\).
The mode is the value that appears most frequently. A dataset can have no mode, one mode (unimodal), or multiple modes (bimodal, multimodal).
Advantages: Easy to calculate and widely used. Disadvantages: Affected by outliers. Applicable to interval and ratio data.
Advantages: Not affected by outliers. Disadvantages: Requires sorting data. Applicable to ordinal, interval, and ratio data.
Advantages: Can be used with categorical data. Disadvantages: May not exist or may be multiple. Applicable to nominal, ordinal, interval, and ratio data.
The range is the difference between the highest and lowest values: \(R = \text{Highest value} - \text{Lowest value}\).
Variance is the average squared deviation from the mean. For a sample: \(s^2 = \frac{\sum (x_i - \bar{x})^2}{n-1}\).
Standard deviation is the square root of the variance, expressed in the same units as the data: \(s = \sqrt{s^2}\).
CV is the standard deviation as a percentage of the mean: \(CV = \frac{s}{\bar{x}} \times 100\%\). It allows comparison of variability between datasets with different units or means.
In symmetric distributions, mean = median. In left-skewed, mean < median. In right-skewed, mean > median.
A z-score indicates how many standard deviations a value is from the mean. For a population: \(z = \frac{x - \mu}{\sigma}\).
Approximately 68% of data fall within ±1 standard deviation, 95% within ±2, and 99.7% within ±3 standard deviations of the mean.
For any distribution, at least \(1 - \frac{1}{k^2}\) of values fall within \(k\) standard deviations of the mean, for \(k > 1\).
Percentiles divide data into 100 equal parts; quartiles divide data into four equal parts: Q1 = 25th percentile, Q2 = 50th percentile (median), Q3 = 75th percentile.
The index is \(i = \frac{p}{100} \times n\), where n is the number of data points.
A boxplot displays the five-number summary: minimum, Q1, median (Q2), Q3, and maximum. Outliers lie beyond \(Q1 - 1.5 \times IQR\) or \(Q3 + 1.5 \times IQR\).
Excel provides tools to calculate mean, median, mode, standard deviation, variance, percentiles, and to create boxplots and histograms using the Data Analysis Toolpak.