 Back
Introduction to Business Statistics
 05:53

Terms in this set (20)
Business statistics is the mathematical science concerned with the collection, analysis, interpretation, and presentation of data for business decision-making.
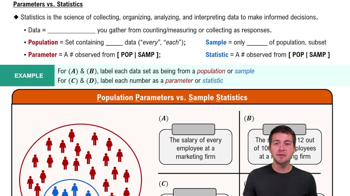
Population is the entire set of items or individuals of interest. Sample is a subset of the population selected for analysis.
Variables are characteristics that can take different values. Data are the actual values that variables assume.
Descriptive statistics summarize and display data. Inferential statistics make predictions or decisions about a population based on sample data.
Descriptive: "The average exam score was 88." Inferential: "Predicting election results by asking voters about their intentions."
Used in marketing (estimating average income), operations (analyzing qualitative variables), finance (examining quantitative relationships).
1. Define the problem
2. Define population/sample
3. Define data nature
4. Use statistical tools
5. Make decisions
Every member of the population has an equal chance of being selected.
Select every \(k\)-th member, where \(k=\frac{N}{n}\), N = population size, n = sample size.
Population divided into strata based on important variables; random samples taken from each stratum.
Population divided into clusters; entire clusters are randomly selected for the sample.
Samples selected based on ease of access; may lead to biased results.
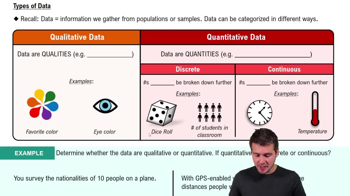
Qualitative (categorical) and Quantitative (numerical) data.
Discrete: countable values. Continuous: measurable values within a range.
Nominal: categories with no ranking. Ordinal: categories with meaningful order but no measurable differences.
Interval: ordered with measurable differences, no true zero. Ratio: like interval but with a true zero point.
Primary data collected directly for a purpose. Secondary data collected by others and reused.
Biased samples and misleading graphs can distort findings and mislead decision-making.
It helps ensure all important subgroups are represented in the sample, improving accuracy.
It represents the interval at which members are selected from the population.