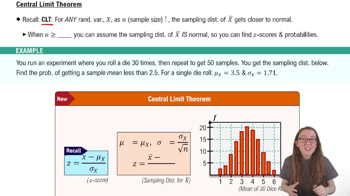
Mean of the sampling distribution of the sample mean
The mean of the sampling distribution of the sample mean is equal to the population mean, \(\mu_{\bar{x}} = \mu\).
Standard deviation of the sampling distribution of the sample mean
The standard deviation of the sampling distribution of the sample mean is the population standard deviation divided by the square root of the sample size, \(\sigma_{\bar{x}} = \frac{\sigma}{\sqrt{n}}\).
Central Limit Theorem sample size guideline
A sample size of at least 30 is commonly required for the sampling distribution of the sample mean to be approximated by a normal distribution, especially if the population distribution is skewed.
t-value interpretation with degrees of freedom
The t-value depends on the desired area and degrees of freedom; for example, with 12 degrees of freedom and area 0.025 to the left, t ≈ -2.179.
Probability of sample mean between two values
To find the probability that the sample mean lies between two values, use the sampling distribution mean and standard deviation, then calculate the corresponding z or t scores.
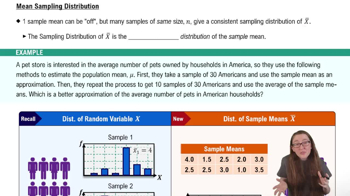
Mean and standard deviation of sample mean from large population
For a sample size k from a large population with mean M and standard deviation S, \(\mu_{\bar{Y}} = M\) and \(\sigma_{\bar{Y}} = \frac{S}{\sqrt{k}}\).
Ordering critical values: t vs z distributions
For the same confidence level, z-values are generally larger than t-values with large degrees of freedom; ordering depends on degrees of freedom and distribution.
Probability of sample mean less than a value with known population SD
Use the z-score formula with known population standard deviation to find the probability that the sample mean is less than a given value.
Constructing a confidence interval for the population mean
A confidence interval is constructed as sample mean ± (t-value × standard error), where standard error is sample SD divided by square root of sample size.
Mean of the sampling distribution of the sample proportion
The mean of the sampling distribution of the sample proportion is equal to the population proportion, \(\mu_{\hat{p}} = p\).
Sample size requirement for normal approximation of sample proportion
To approximate the sampling distribution of the sample proportion by a normal distribution, both \(np \geq 5\) and \(n(1-p) \geq 5\) must hold.
Probability of sample containing certain number of successes
Use the binomial or normal approximation to find the probability that a sample contains a specified number or fewer individuals with an attribute.
Sample proportion as an unbiased estimator
The sample proportion \(\hat{p}\) is an unbiased estimator of the population proportion \(p\).
Relationship between binomial distribution and sampling distribution of p̂
The sampling distribution of the sample proportion \(\hat{p}\) is a rescaled version of the binomial distribution of the number of successes X.
Probability sample proportion lies between two values for fair coin flips
For 60 flips of a fair coin, the probability that the sample proportion of heads is between 0.4 and 0.6 is approximately 0.879.
 Back
Back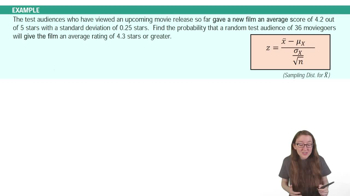
 02:33
02:33