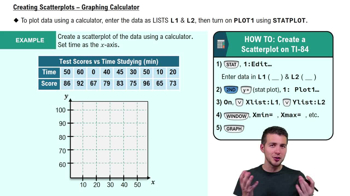
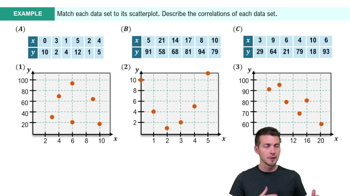
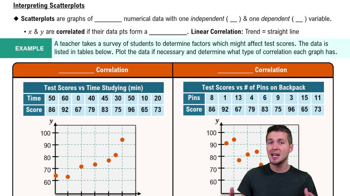
A scatterplot displays pairs of values for two numerical variables, showing the relationship between an explanatory variable (x) and a response variable (y).
What are the four features to describe in a scatterplot?
Direction (positive/negative), form (linear/curved), variation (tightness of points), and outliers (unusual points).
What does covariance measure?
Covariance measures the direction and amount of linear association between two variables but depends on their units.
What is correlation (r)?
Correlation is a standardized measure of linear association between −1 and +1, indicating direction and strength without units.
Interpret correlation values: r = 1, r close to 0, r = −1.
r = 1: perfect positive linear association; r close to 0: little linear association; r = −1: perfect negative linear association.
What does r = 0 mean?
r = 0 means no linear association, but variables could still have a curved relationship.
What is the standardized form of the correlation line?
The line is \(\hat{z}_y = r z_x\), where slope equals r and z-values are standardized.
What is the slope-intercept form of the regression line?
The line is \(\hat{y} = a + b x\), where a is the intercept and b is the slope.
How to interpret the slope in regression?
The slope b predicts the average change in y for a one-unit increase in x.
What is spurious correlation?
An association caused by a lurking variable, not a direct causal relationship between the two variables.
What is the least squares regression line?
The line that minimizes the sum of squared residuals, summarizing how the average response y changes with x.
How to calculate a residual?
Residual = actual value − predicted value (\(e = y - \hat{y}\)).
What does a residual plot show?
It shows residuals versus x; a good linear model has residuals scattered around zero with no pattern.
What does R-squared (R²) represent?
R² is the fraction of variation in y explained by the regression line.
What is residual standard deviation (sₑ)?
sₑ measures the typical size of prediction errors left unexplained by the model, in y's units.
What does a small p-value indicate in regression?
Strong evidence against the null hypothesis that the population slope is zero, suggesting a linear relationship.
What are the conditions for simple linear regression?
No lurking variable, linear pattern in scatterplot, random residual variation with no pattern.
What is heteroscedasticity?
Residual variation changes across x-values, often seen as a fan-shaped residual plot.
What is high leverage in regression diagnostics?
An observation with an unusual x-value that can disproportionately influence the regression line.
What does the Durbin–Watson test detect?
It tests for autocorrelation in residuals; a value near 2 indicates no autocorrelation.
What is the difference between a confidence interval and a prediction interval?
Confidence intervals estimate population coefficients; prediction intervals estimate where a new response may fall.
 Back
 06:36