Histograms
- Download the worksheet to save time writing
- Start solving the practice problems
- If you're stuck, watch the video solutions
- See your summary to get more insights

Histograms
4 problems
Problem 1Multiple Choice
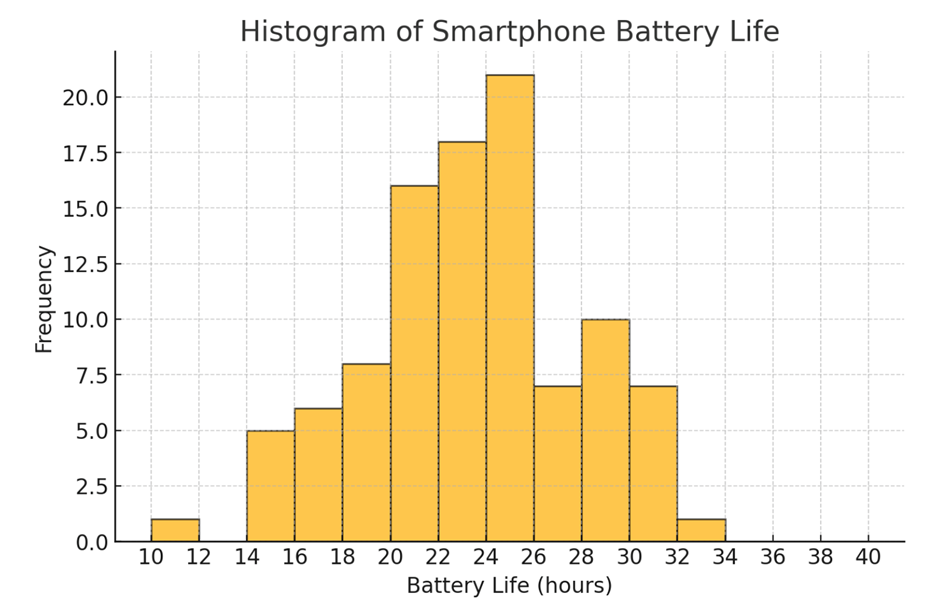
Use the following histogram generated by statistical software, which represents the battery life (in hours) of a sample of smartphones. (The values on the horizontal scale are rounded.)
What is the approximate number of smartphones represented in the three bars farthest to the right?
Problem 2Multiple Choice
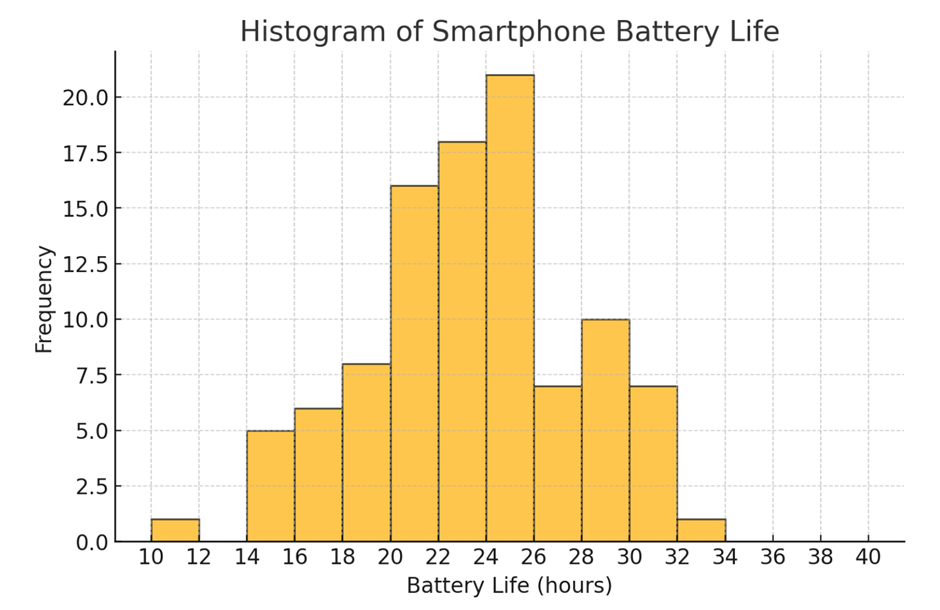
Use the following histogram generated by statistical software, which represents the battery life (in hours) of a sample of smartphones. Provide the estimated class width, along with the lower- and upper-class limits of the fourth bar from the left in the histogram.