 Back
College Algebra: Functions, Graphs, and Models
 3:43

Terms in this set (20)
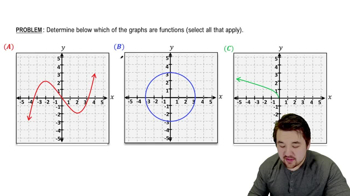
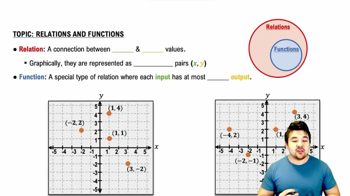
A function is a relation where each input has exactly one output.
Use the vertical line test: if any vertical line crosses the graph more than once, it is not a function.
A piecewise defined function is defined by different expressions over different intervals of the domain.
Common types include linear, quadratic, absolute value, square root, cubic, cube root, and rational functions.
Transformations include translations (shifts), reflections, stretches, and compressions of the graph.
Adding a constant k outside the function, \(f(x)+k\), shifts the graph vertically by k units.
Adding a constant h inside the argument, \(f(x+h)\), shifts the graph horizontally by -h units.
The general form is \(f(x)=mx+b\), where m is the slope and b is the y-intercept.
The slope represents the rate of change or how much y changes for a unit change in x.
Linear functions have a constant slope, their graphs are straight lines, and they have no curvature.
The standard form is \(f(x)=ax^2+bx+c\), where a, b, and c are constants and a \(\neq\) 0.
If a > 0, the parabola opens upward; if a < 0, it opens downward. The value of a also affects the width.
The vertex is the highest or lowest point on the parabola, representing the maximum or minimum value.
The vertex's x-coordinate is \(-\frac{b}{2a}\). Substitute this into the function to find the y-coordinate.
The axis of symmetry is the vertical line through the vertex, given by \(x=-\frac{b}{2a}\).
The constant c represents the y-intercept, where the graph crosses the y-axis.
Quadratic models describe situations with a maximum or minimum, such as projectile motion or area optimization.
Graph each piece on its specified domain interval, using open or closed dots to indicate inclusion or exclusion of endpoints.
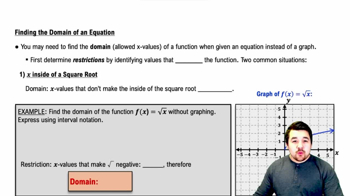
The domain is the set of all possible input values (x-values) for which the function is defined.
The range is the set of all possible output values (y-values) of the function.