 Indietro
cell 120
 01:35
01:35
Termini in questo insieme (20)
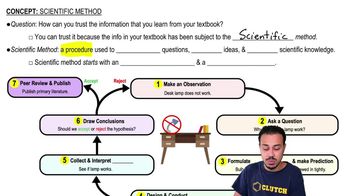
Observation, Question, Hypothesis, Experiment, Data Analysis, and Conclusion.
Based on observations or previous knowledge, answerable or measurable, leads to experiments, and involves a testable hypothesis.
The predicted conclusion that the treatment will have no effect. It is the negative hypothesis.
The hypothesis that is the opposite of the null, representing what you are actually testing for.
Dependent variable: what the researcher measures; depends on another variable.
Independent variable: what the researcher controls or varies; does not depend on another variable.
Parameter: measurable characteristic of the system (e.g., concentration).
Dimension: units of a parameter (e.g., grams, liters).
Positive control: treatment known to give a response, confirming the alternate hypothesis.
Negative control: absence of treatment, confirming the null hypothesis.
Sum of all values divided by the number of samples: \(\frac{\sum x_i}{n}\).
The middle value of ordered data.
The average variation or spread of data points around the mean.
Larger variation results in a larger standard deviation; smaller variation results in a smaller standard deviation.
Calculate squared differences from the mean, sum them, divide by n-1, then take the square root.
SEM = standard deviation divided by the square root of sample size: \(\frac{s}{\sqrt{n}}\).
If the intervals overlap, the null hypothesis is not rejected (no significant difference).
If the intervals do not overlap, the null hypothesis is rejected (significant difference).
Rejecting the null hypothesis when it is actually true; the p-value is the probability of this error.
Accepting the null hypothesis when it is actually false; probability is 1 minus the p-value.
Sample size affects the standard error and confidence in rejecting or accepting the null hypothesis.
To determine p-values for inferences about the null hypothesis based on data distribution, variance, and experimental design.
The bar height shows the mean; error bars show variability. Overlapping error bars do not necessarily mean no significant difference.