 Indietro
General Biology Chapter 1 Key Concepts
 02:09
02:09

Termini in questo insieme (25)
Science is the systematic study of the natural world through observation and experimentation.
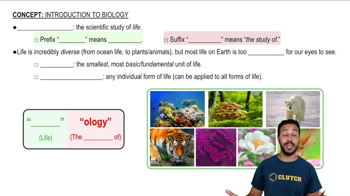
Biology is the study of living organisms and their interactions with the environment.
Characteristics that define living things, including growth, reproduction, response to stimuli, metabolism, and homeostasis.
Hierarchy from molecules to cells, tissues, organs, organisms, populations, communities, ecosystems, and biosphere.
New characteristics that arise at each level of biological organization that are not present at lower levels.
Classification hierarchy including domain, kingdom, phylum, class, order, family, genus, and species.
Biological structures are shaped to perform specific functions essential for life.
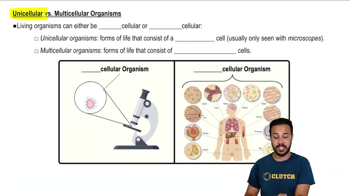
A cell type with a nucleus and membrane-bound organelles.
A cell type without a nucleus or membrane-bound organelles, such as bacteria.
Inductive reasoning derives general principles from specific observations; deductive reasoning applies general principles to predict specific outcomes.
A process involving observation, hypothesis formation, experimentation, and conclusion to test ideas.
A testable and falsifiable prediction based on observations.
A well-supported explanation of natural phenomena based on extensive evidence.
A statement describing a consistent natural relationship, often expressed mathematically.
Controlled experiments manipulate variables to test effects; observational experiments involve monitoring without intervention.
Identify the independent variable on the x-axis and the dependent variable on the y-axis to interpret data trends.
The variable that is deliberately changed or manipulated in an experiment.
The variable that is measured or observed in response to changes in the independent variable.
A line on a graph that shows the general direction or pattern of data points.
A statistical measure that indicates how well data fit a trend line; ranges from 0 to 1.
Correlation means two variables are related; causation means one variable causes the other.
A statistical value that indicates the probability results are due to chance; lower values suggest stronger evidence against the null hypothesis.
A measure of the amount of variation or dispersion in a set of data values.
Parametric tests assume data follow a normal distribution; non-parametric tests do not require this assumption.
The process by which scientific work is evaluated by experts before publication to ensure quality and validity.