 Indietro
Unit 8 Flashcards

 05:01

Termini in questo insieme (67)
Population = one species in one place.
Community = all populations in one place.
Ecosystem = community + nonliving environment.
Biotic = living or caused by living things (predators, food, disease).
Abiotic = nonliving (water, light, temperature, soil, nutrients).
Climate controls biomes: on land, temperature and precipitation; in water, light, nutrients, salinity, oxygen, and depth.
Desert: very dry, plants spread out.
Tundra: cold, short growing season, permafrost.
Tropical forest: warm, wet, many layers, high diversity.
Photic: enough light for photosynthesis.
Aphotic: too dark for photosynthesis.
Benthic: bottom.
Pelagic: open water.
Estuary: where river meets ocean.
Wetland: land covered by water sometimes.
Intertidal: shore covered/uncovered by tides.
Population change = births + immigration - deaths - emigration.
Density: number of organisms in an area.
Dispersion: spacing patterns - clumped, uniform, or random.
Clumped: groups near food or safety.
Uniform: spaced by territory or competition.
Random: chance spacing in similar habitat.
Catch and mark animals, release, then recapture.
If many marked in second catch, population is small; if few, population is large.
J-shaped curve; growth accelerates as population grows.
Occurs when resources are plentiful.
Model: dN/dt = rN.
S-shaped curve; growth slows as resources limit population.
Carrying capacity (K) = max population environment supports.
Model: dN/dt = rN((K-N)/K).
Density-dependent: stronger with crowding (competition, disease, predation).
Density-independent: affect populations regardless of size (storms, fires, droughts).
Type I: most survive to old age (humans).
Type II: constant death rate (many birds).
Type III: many die young, few survive (oysters).
Wide base = many young, fast growth.
Rectangular = slow or stable growth.
Narrow base = low birth rate, possible decline.
Cohort: group born around same time.
Life table: shows survival and reproduction by age to predict population changes.
Semelparity: reproduce once with many offspring, then die.
Iteroparity: reproduce multiple times over life.
r-selected: many small young, little care, fast boom-bust growth.
K-selected: fewer young, more care, slower growth near carrying capacity.
Several local populations connected by movement.
Immigration can recolonize patches.
Habitat corridors facilitate movement.
Which species are present, how many kinds, and their relative abundance.
Competition = -/- interaction for limited resources.
Competitive exclusion: two species with identical niches cannot coexist indefinitely.
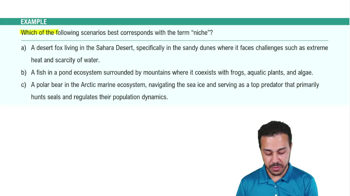
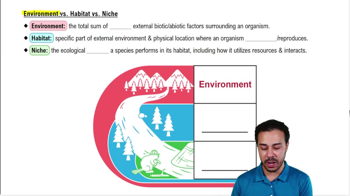
Fundamental niche: all conditions a species could use without competition.
Realized niche: actual conditions used when competitors/predators present.
Similar species coexist by using resources differently, reducing competition (e.g., birds feeding in different tree parts).
Natural selection causes similar species living together to evolve different traits to reduce competition.
Predation: predator kills and eats prey (+/-).
Herbivory: animal eats plant or algae parts (+/-). Both affect population sizes.
Parasite benefits, host is harmed (+/-). Usually does not kill host immediately (e.g., tick on deer).
Mutualism: both benefit (+/+), e.g., pollinator and flower.
Commensalism: one benefits, other unaffected (+/0).
Richness: number of species.
Evenness: how evenly individuals are distributed among species.
High richness and evenness = high diversity.
1 - sum((n/N)\(^2\)), where n = number in one species, N = total organisms.
Larger value means more diverse community.
Food chain: single energy pathway.
Food web: many interconnected feeding paths.
Arrows point to organism receiving energy.
Producer -> primary consumer -> secondary consumer -> tertiary consumer.
Decomposers break down dead matter at all levels.
Foundation species: large/abundant, build habitat (trees, corals).
Keystone species: may be rare but have large community impact (sea star).
Organism that changes physical environment, affecting many species (e.g., beavers build dams creating wetlands).
Bottom-up: nutrients/food at lower levels control higher levels.
Top-down: predators control lower levels.
Example: fewer fish -> more zooplankton -> less algae.
Primary: starts without soil (bare rock after glacier).
Secondary: soil remains after disturbance (fire), usually faster recovery.
Energy flows one way and leaves as heat.
Matter cycles (carbon, nitrogen, water) and is reused.
Producers make food using light/chemical energy.
Consumers eat other organisms.
Decomposers break down dead material, returning nutrients.
GPP: total energy captured by producers.
NPP: GPP minus producer respiration; energy available to consumers.
NEP: GPP minus all ecosystem respiration; positive NEP means carbon storage.
Photosynthesis requires light and nutrients.
Limiting nutrient is missing nutrient slowing growth.
In water, nitrogen or phosphorus often limits growth.
Excess nutrients -> algae bloom -> algae die -> decomposers use oxygen -> low oxygen/dead zone.
Often caused by fertilizer runoff.
Only about 10% of energy moves to next trophic level.
About 90% lost as heat or used for life processes.
This limits food chain length.
Energy pyramid always decreases upward.
Biomass pyramid usually decreases but can be inverted in aquatic systems due to fast phytoplankton turnover.
Decomposers work faster when warm, wet, and oxygen-rich.
Cold, dry, or low-oxygen conditions slow decomposition, allowing dead material buildup.
Evaporation: liquid to vapor.
Condensation: vapor to clouds.
Precipitation: water falls.
Runoff/groundwater returns water.
Transpiration: water leaves plants.
CO2 taken by plants via photosynthesis.
Carbon moves through food webs.
Respiration, decomposition, and burning release CO2.
More CO2 increases greenhouse effect.
Most N2 gas unusable by plants.
Fixation converts N2 to usable forms.
Plants absorb nitrogen; animals eat plants.
Denitrification returns N2 to air.
Phosphate released by weathering rocks.
Plants absorb phosphate; animals eat plants.
Waste and decomposition recycle it.
No major gas phase; moves slowly.
Bioremediation uses living things to remove or detoxify pollution.
Biological augmentation adds organisms/materials to aid recovery (e.g., nitrogen-fixing plants).
Genetic diversity: DNA differences within/between populations.
Species diversity: variety of species.
Ecosystem diversity: variety of ecosystems.
Biodiversity stabilizes ecosystems and aids recovery.
Provides ecosystem services: clean water, pollination, food, medicine, flood control.
Loss destroys living space.
Fragmentation breaks habitat into small pieces.
Small, isolated populations have less gene flow and higher extinction risk.
Introduced species moved by humans to new areas.
Invasive species spread and harm native species via competition, predation, or disease.
Taking organisms faster than they can reproduce.
Species with slow reproduction are vulnerable (e.g., tuna, elephants, whales).
Critical load = max nutrient input ecosystem can handle without harm.
Exceeding it causes eutrophication and dead zones.
Bioaccumulation: toxin builds up inside one organism over time.
Biomagnification: toxin concentration increases at higher trophic levels.
Greenhouse gases absorb heat leaving Earth and re-radiate some back.
This natural effect keeps Earth warm.
Extra gases trap more heat, causing warming.
CO2 levels have risen since industrialization.
Global temperatures have increased.
Climate models match observed warming only when human causes included.
Heat affects enzyme activity, body temperature, feeding, reproduction, survival.
Species may shift ranges, change timing, shrink, or go extinct.
Food webs can be disrupted.
Ozone depletion: less stratospheric ozone, more UV reaches Earth, caused by CFCs.
Climate change: more greenhouse gases trap heat.
They are different problems.
Small population -> inbreeding/genetic drift -> less genetic diversity -> lower survival/reproduction -> even smaller population.
This feedback loop can lead to extinction.
Number of individuals actually breeding and passing genes.
Usually smaller than total population size.
Smallest population size likely to survive long term.
Depends on reproduction, disasters, genetics, habitat.
Conservation aims to keep populations above MVP.
Specific habitat features a species needs to survive and reproduce.
Protecting these is key to species conservation.
Connect separated habitat patches.
Allow organism movement, mating, gene flow.
Can reduce inbreeding but may spread disease.
Edges between habitats have different light, wind, temperature, and species.
More fragmentation increases edges, harming interior species.
Small area with many unique and threatened species.
Protecting it saves many species at once.
Protected areas save habitat.
Zoned reserves have a protected core and buffer zones allowing some human use.
Buffers reduce harm to core.