In all exercises, other than exercises with no solution, use interval notation to express solution sets and graph each solution set on a number line. In Exercises 27–50, solve each linear inequality. 1 - x/2 > 4
Ch. 1 - Equations and Inequalities

Capitolo 2, Problema 43a
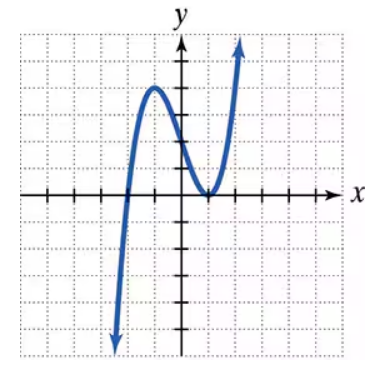
Use the graph to a. determine the x-intercepts, if any; b. determine the y-intercepts, if any. For each graph, tick marks along the axes represent one unit each.

Guida verificata passo dopo passo1
Observe the graph and identify the points where the curve crosses the x-axis. These points are the x-intercepts. The x-intercepts occur when the y-value is 0.
From the graph, locate the x-coordinates of the points where the curve intersects the x-axis. These are the x-intercepts.
Next, identify the point where the curve crosses the y-axis. This point is the y-intercept. The y-intercept occurs when the x-value is 0.
From the graph, locate the y-coordinate of the point where the curve intersects the y-axis. This is the y-intercept.
Summarize the x-intercepts and y-intercept based on the observations from the graph.

Risposta video verificata per un problema simile:
Questa soluzione video è stata consigliata dai nostri tutor come utile per risolvere questo problema.
Durata del video:
1mConcetti chiave
Ecco i concetti essenziali che devi comprendere per rispondere correttamente alla domanda.
X-Intercepts
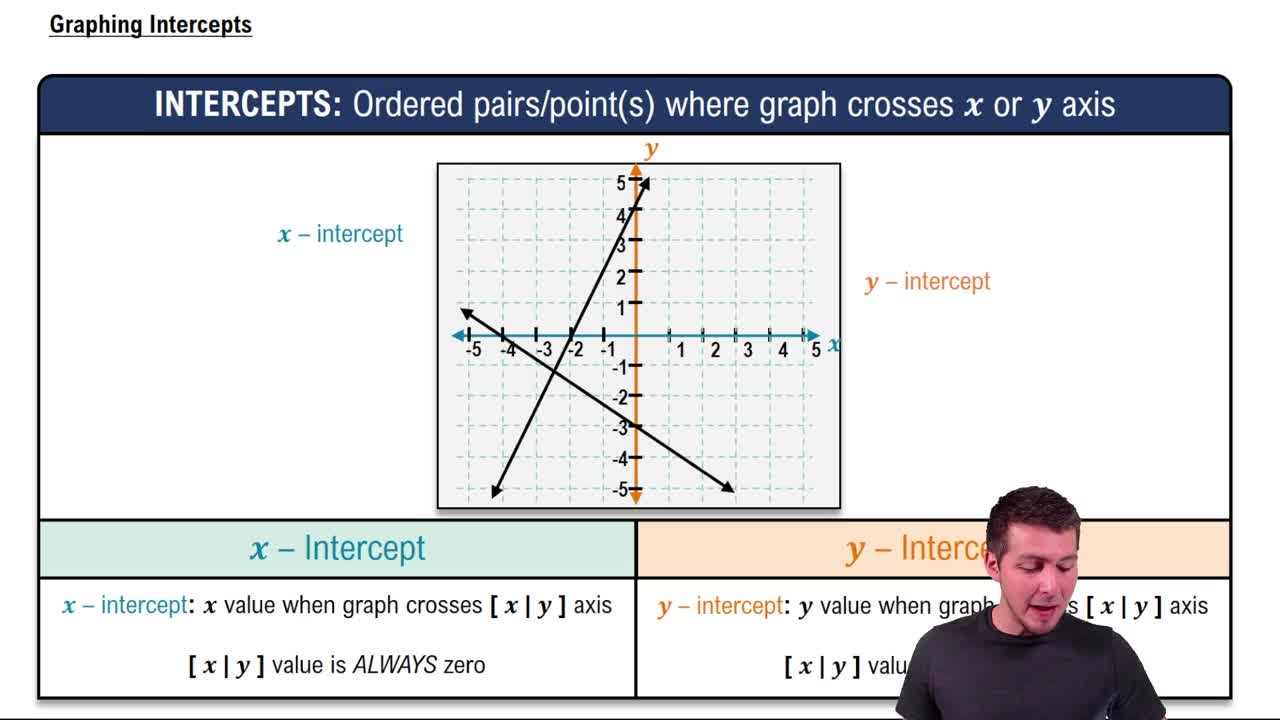
X-intercepts are the points where a graph crosses the x-axis. At these points, the value of y is zero. To find the x-intercepts, one can set the function equal to zero and solve for x. In graphical terms, these are the horizontal intersections of the curve with the x-axis.
Video consigliato:
Graphing Intercepts
Y-Intercepts
Y-intercepts are the points where a graph crosses the y-axis, occurring when the value of x is zero. To determine the y-intercept, substitute x = 0 into the function and solve for y. Graphically, these points represent the vertical intersections of the curve with the y-axis.
Video consigliato:
Graphing Intercepts
Graph Interpretation
Graph interpretation involves analyzing the visual representation of a function to extract meaningful information, such as intercepts, trends, and behavior at extremes. Understanding how to read a graph, including the significance of axes and tick marks, is crucial for accurately identifying intercepts and other features of the function.
Video consigliato:
Graphs and Coordinates - Example
Pratica correlata
Domanda del libro di testo
770
views
Domanda del libro di testo
Solve and check: 24 + 3 (x + 2) = 5(x − 12).
873
views
Domanda del libro di testo
In Exercises 37–52, perform the indicated operations and write the result in standard form. (- 3 - √-7)2
830
views
Domanda del libro di testo
Use the graph to a. determine the x-intercepts, if any; b. determine the y-intercepts, if any. For each graph, tick marks along the axes represent one unit each.
112
views
Domanda del libro di testo
Exercises 41–60 contain rational equations with variables in denominators. For each equation, a. write the value or values of the variable that make a denominator zero. These are the restrictions on the variable. b. Keeping the restrictions in mind, solve the equation. 7/2x - 5/3x = 22/3
844
views
Domanda del libro di testo
Solve each equation in Exercises 41–60 by making an appropriate substitution.
720
views