In Exercises 81–88, a. Find the slant asymptote of the graph of each rational function and b. Follow the seven-step strategy and use the slant asymptote to graph each rational function. f(x)=(x2+x−6)/(x−3)
Ch. 3 - Polynomial and Rational Functions

Capitolo 4, Problema 87
Solve each inequality in Exercises 86–91 using a graphing utility. 2x2 + 5x - 3 ≤ 0
Guida verificata passo dopo passo1
Identify the inequality to solve: \(2x^{2} + 5x - 3 \leq 0\).
Rewrite the inequality as an equation to find critical points: \(2x^{2} + 5x - 3 = 0\).
Use the quadratic formula to solve for \(x\): \(x = \frac{-b \pm \sqrt{b^{2} - 4ac}}{2a}\), where \(a=2\), \(b=5\), and \(c=-3\).
Calculate the roots from the quadratic formula; these roots divide the number line into intervals to test for the inequality.
Use a graphing utility to plot \(y = 2x^{2} + 5x - 3\) and determine where the graph lies on or below the \(x\)-axis (i.e., where \(y \leq 0\)) to find the solution intervals.

Risposta video verificata per un problema simile:
Questa soluzione video è stata consigliata dai nostri tutor come utile per risolvere questo problema.
Durata del video:
1mConcetti chiave
Ecco i concetti essenziali che devi comprendere per rispondere correttamente alla domanda.
Quadratic Inequalities
A quadratic inequality involves a quadratic expression set less than, greater than, or equal to zero. Solving it requires finding the range of x-values where the quadratic expression satisfies the inequality, often by analyzing the parabola's position relative to the x-axis.
Video consigliato:
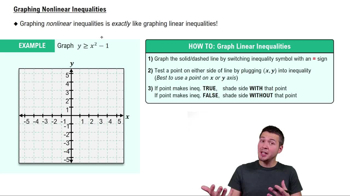
Nonlinear Inequalities
Graphing Quadratic Functions
Graphing a quadratic function y = ax² + bx + c produces a parabola. The graph helps visualize where the function is above or below the x-axis, which corresponds to positive or negative values of the quadratic expression, aiding in solving inequalities.
Video consigliato:
Graphs of Logarithmic Functions
Using Graphing Utilities
Graphing utilities, such as graphing calculators or software, allow quick plotting of functions to identify roots and intervals where inequalities hold. They provide a visual method to solve quadratic inequalities by showing where the graph lies relative to the x-axis.
Video consigliato:
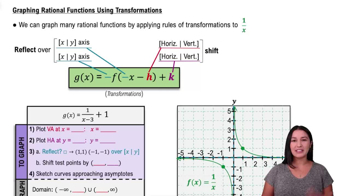
Graphing Rational Functions Using Transformations
Pratica correlata
Domanda del libro di testo
629
views
Domanda del libro di testo
Solve each inequality in Exercises 86–91 using a graphing utility. (x - 4)/(x - 1) ≤ 0
495
views
Domanda del libro di testo
In Exercises 81–88, a. Find the slant asymptote of the graph of each rational function and b. Follow the seven-step strategy and use the slant asymptote to graph each rational function. f(x)=(x3+1)/(x2+2x)
601
views
Domanda del libro di testo
Solve each inequality in Exercises 86–91 using a graphing utility. x2 + 3x - 10 > 0
573
views
Domanda del libro di testo
Solve each inequality in Exercises 86–91 using a graphing utility. x3 + x2 - 4x - 4 > 0
548
views
Domanda del libro di testo
In Exercises 89–94, the equation for f is given by the simplified expression that results after performing the indicated operation. Write the equation for f and then graph the function. 5x2/(x2−4) ⋅ (x2+4x+4)/(10x3)
800
views