Use the Leading Coefficient Test to determine the end behavior of the graph of the polynomial function.
Ch. 3 - Polynomial and Rational Functions

Capitolo 4, Problema 19
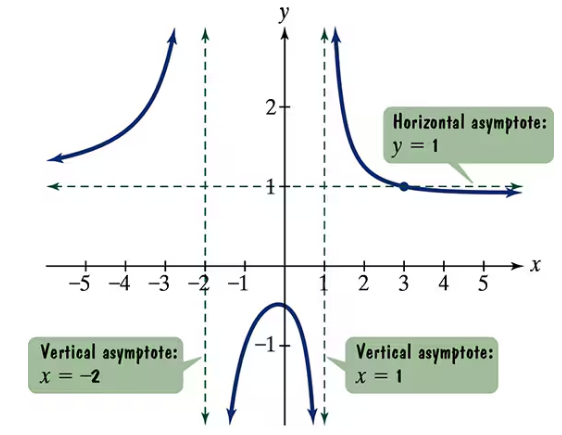
Use the graph of the rational function in the figure shown to complete each statement in Exercises 15–20.

As _____
Guida verificata passo dopo passo1
Identify the horizontal asymptote from the graph. The horizontal asymptote is the line that the function approaches as x approaches infinity or negative infinity.
From the graph, observe the horizontal dashed line labeled as the horizontal asymptote, which is at y = 17.
Recall that for rational functions, the horizontal asymptote represents the value that f(x) approaches as x approaches infinity (x → ∞) or negative infinity (x → -∞).
Therefore, as x → ∞, the function f(x) approaches the horizontal asymptote y = 17.
Write the conclusion: As x → ∞, f(x) → 17.

Risposta video verificata per un problema simile:
Questa soluzione video è stata consigliata dai nostri tutor come utile per risolvere questo problema.
Durata del video:
1mConcetti chiave
Ecco i concetti essenziali che devi comprendere per rispondere correttamente alla domanda.
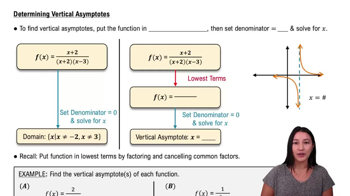
Vertical Asymptotes
Vertical asymptotes occur where a rational function's denominator is zero and the function approaches infinity or negative infinity. They represent values of x where the function is undefined and the graph shows a vertical line that the curve approaches but never crosses.
Video consigliato:
Percorso guidato
Determining Vertical Asymptotes
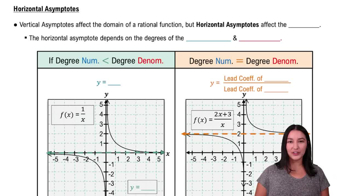
Horizontal Asymptotes
Horizontal asymptotes describe the behavior of a function as x approaches infinity or negative infinity. For rational functions, the horizontal asymptote is a horizontal line y = c that the graph approaches, indicating the end behavior of the function.
Video consigliato:
Percorso guidato
Determining Horizontal Asymptotes
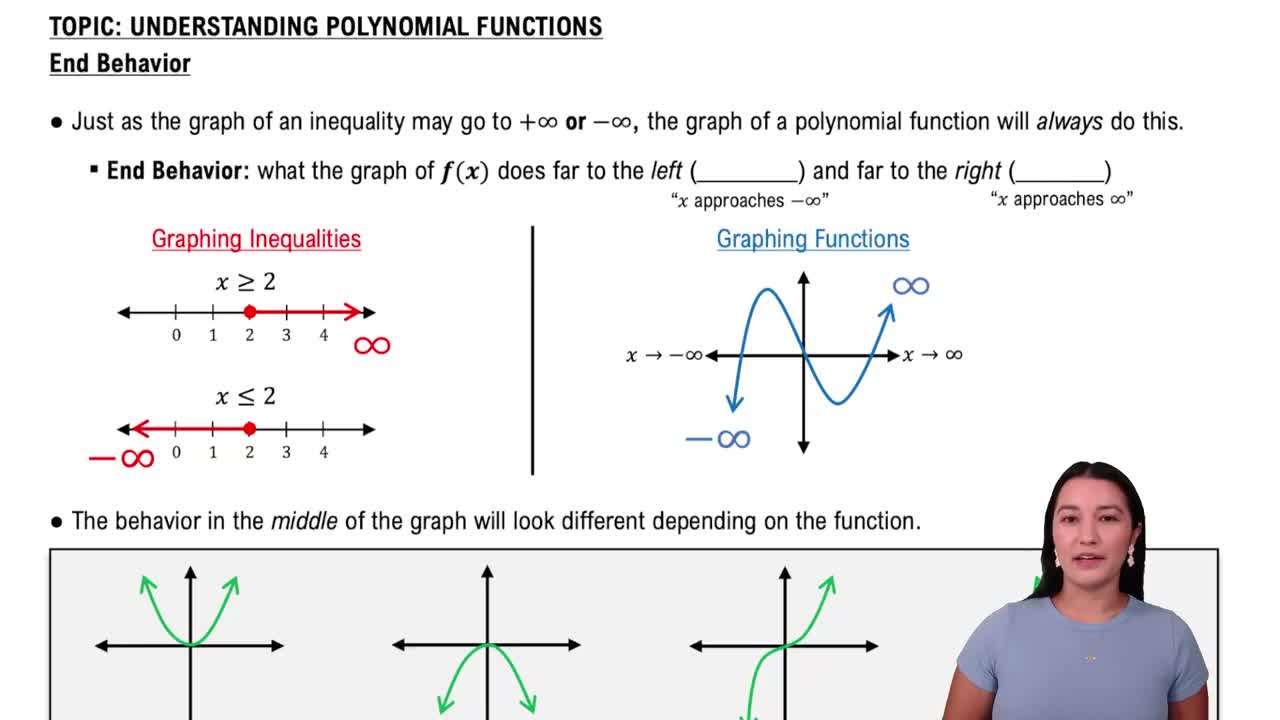
End Behavior of Rational Functions
The end behavior of a rational function is determined by the degrees of the numerator and denominator polynomials. It shows how the function behaves as x approaches positive or negative infinity, often approaching a horizontal asymptote or increasing/decreasing without bound.
Video consigliato:
Percorso guidato
End Behavior of Polynomial Functions
Pratica correlata
Domanda del libro di testo
660
views
Domanda del libro di testo
Use the Leading Coefficient Test to determine the end behavior of the graph of the polynomial function.
1091
views
Domanda del libro di testo
Divide using synthetic division. (3x2+7x−20)÷(x+5)
563
views
Domanda del libro di testo
Solve each polynomial inequality in Exercises 1–42 and graph the solution set on a real number line. Express each solution set in interval notation.
639
views
Domanda del libro di testo
Use the vertex and intercepts to sketch the graph of each quadratic function. Give the equation of the parabola's axis of symmetry. Use the graph to determine the function's domain and range. f(x)=(x−1)2+2
838
views
Domanda del libro di testo
Write an equation that expresses each relationship. Then solve the equation for y. x varies directly as z and inversely as the sum of y and w.
571
views