Unisciti a migliaia di studenti che si affidano a noi per superare al meglio i loro esami!
Scelta multipla
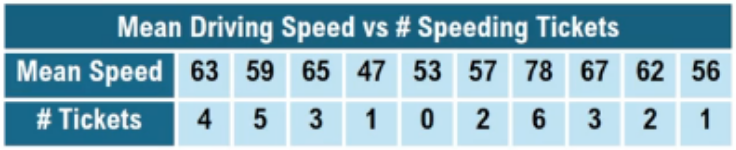
The table shows the mean driving speed of drivers in a 55mph zone and the number of speeding tickets they've received in the past 10 years. Plot the data in a scatterplot with speed on the x-axis. What can you determine about the relationship between mean speed and the number of speeding tickets?
A
Positive correlation
B
Negative correlation
C
Nonlinear correlation
D
No correlation
0 Commenti
Guida verificata passo dopo passo
1
Step 1: Identify the variables for the scatterplot. The mean driving speed will be on the x-axis, and the number of speeding tickets will be on the y-axis.
Step 2: Plot each pair of data points from the table on the scatterplot. For example, plot the point (63, 4), then (59, 5), (65, 3), and so on for all the pairs.
Step 3: After plotting all points, observe the overall pattern or trend in the scatterplot. Look for whether the points tend to rise, fall, or show no clear pattern as speed increases.
Step 4: Determine the type of correlation based on the pattern. If points tend to rise together (higher speed with more tickets), it is a positive correlation. If points fall (higher speed with fewer tickets), it is a negative correlation. If the pattern is curved or irregular, it may be nonlinear. If no pattern is visible, there is no correlation.
Step 5: Conclude the relationship by describing the correlation type you observe from the scatterplot based on the plotted data.


 Guida verificata passo dopo passo


