Skip to main content
Macroeconomics
Il mio corso
Impara
Preparazione agli esami
AI Tutor
Guide di studio
Flashcard
Esplora
Prova l'app
Il mio corso
Impara
Preparazione agli esami
AI Tutor
Guide di studio
Flashcard
Esplora
Prova l'app
Indietro
Perfect Competition Profit on the Graph definitions
Puoi toccare per girare la carta.
Profit Maximizing Quantity
Puoi toccare per girare la carta.
👆
Profit Maximizing Quantity
Production level where additional revenue from selling one more unit equals the extra cost of producing it.
Avanzamenti del tracciato
I pulsanti di controllo sono stati cambiati in modalità "navigazione".
1/15
Flashcard correlate
Video consigliati
Perfect Competition Profit on the Graph quiz
Perfect Competition Profit on the Graph
15 Termini
VideoThumbView.guidedCourse
13:25
Profit on the Graph in Perfect Competition
3
views
Termini in questo insieme (15)
Nascondere definizioni
Profit Maximizing Quantity
Production level where additional revenue from selling one more unit equals the extra cost of producing it.
Marginal Revenue
Extra income received from selling one additional unit, identical to price in perfect competition.
Marginal Cost
Additional expense incurred from producing one more unit of output.
Average Total Cost
Total cost divided by quantity produced, representing per-unit production expense.
Demand Curve
Graphical representation showing the relationship between market price and quantity a firm can sell.
Loss Minimizing Quantity
Output level where losses are smallest, found where additional revenue equals additional cost.
Break Even Point
Situation where total revenue exactly covers total costs, resulting in zero profit or loss.
Perfect Competition
Market structure with many firms selling identical products, where each is a price taker.
Profit
Total earnings calculated as the difference between price and average total cost, multiplied by quantity.
Price
Market-determined value per unit, equal to both marginal and average revenue in perfect competition.
Cost Curve
Graph showing how production expenses change with varying output levels.
Quantity Axis
Horizontal line on a graph representing the number of units produced or sold.
Market Equilibrium
State where market supply equals demand, determining the prevailing price and quantity.
Average Revenue
Income per unit sold, identical to price in perfectly competitive markets.
Total Revenue
Overall income from sales, found by multiplying price by quantity sold.
 IndietroIndietro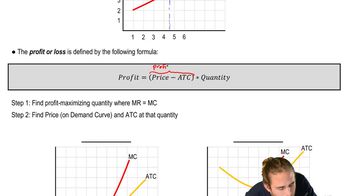
 13:25
13:25