 Indietro
Normal Distribution Basics
 08:50
08:50

Termini in questo insieme (20)
The normal distribution is a continuous probability distribution that is symmetric and bell-shaped, describing many natural phenomena.
The mean (μ) determines the center, and the standard deviation (σ) controls the spread of the normal distribution.
The curve is bell-shaped, symmetric about the mean, with tails that approach but never touch the horizontal axis.
Approximately 68% of data falls within 1σ, 95% within 2σ, and 99.7% within 3σ of the mean.
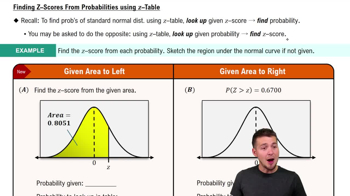
The standard normal distribution has a mean of 0 and a standard deviation of 1, denoted as \(N(0,1)\).
A z-score measures how many standard deviations a data point is from the mean, calculated as \(z=\frac{x-\mu}{\sigma}\).
Z-scores allow comparison of values from different normal distributions by standardizing them to the standard normal distribution.
The PDF is \(f(x)=\frac{1}{\sigma\sqrt{2\pi}}e^{-\frac{(x-\mu)^2}{2\sigma^2}}\).
The total area under the curve equals 1, representing the total probability of all outcomes.
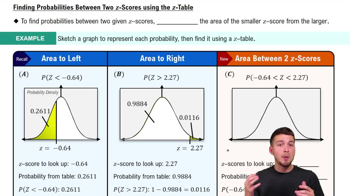
Use the standard normal table or software to find probabilities corresponding to z-scores.
Increasing σ makes the curve wider and flatter, indicating more spread in the data.
Changing μ shifts the curve left or right without changing its shape.
Many statistical methods assume normality because of the Central Limit Theorem and its natural occurrence in data.
The CLT states that the sampling distribution of the sample mean approaches a normal distribution as sample size increases, regardless of the population distribution.
It provides critical values and p-values by comparing test statistics to the normal or standard normal distribution.
A percentile indicates the value below which a given percentage of observations fall in the distribution.
Use the transformation \(Z=\frac{X-\mu}{\sigma}\) to standardize.
The distribution is symmetric about the mean, so probabilities equidistant from the mean are equal.
The mode is the same as the mean and median, located at the peak of the curve.
The distribution becomes a spike at the mean, representing no variability.