Ch. 6 - Confidence Intervals
Larson - Elementary Statistics: Picturing the World 8th Edition
Larson8th EditionElementary Statistics: Picturing the WorldISBN: 9780137493470Non è quello che usi tu?Cambia libro di testo
Capitolo 6, Problema 6.3.4

"Finding p^ and q^ In Exercises 3–6, let p be the population proportion for the situation. Find point estimates of p and q.
Social Security In a survey of 351 retired Americans, 200 said that they rely on Social Security as major source of income. (Adapted from Gallup)"

Guida verificata passo dopo passo
1
Identify the given values: The total number of surveyed retired Americans is 351, and the number of those who rely on Social Security as a major source of income is 200.
Understand the formula for the point estimate of the population proportion (p^): p^ = x / n, where x is the number of successes (in this case, the number of people relying on Social Security) and n is the total sample size.
Substitute the given values into the formula: p^ = 200 / 351.
Calculate the complement of the population proportion (q^): q^ = 1 - p^. This represents the proportion of people who do not rely on Social Security as a major source of income.
Summarize the results: p^ is the point estimate for the proportion of people relying on Social Security, and q^ is the complement proportion. These values are derived from the sample data.

Risposta video verificata per un problema simile:

Questa soluzione video è stata consigliata dai nostri tutor come utile per risolvere questo problema.
Durata del video:
2m

Concetti chiave

Ecco i concetti essenziali che devi comprendere per rispondere correttamente alla domanda.

Population Proportion

The population proportion, denoted as p, represents the fraction of a population that possesses a certain characteristic. In this context, it refers to the proportion of retired Americans who rely on Social Security as a major source of income. Understanding this concept is crucial for estimating how widespread a particular opinion or behavior is within a larger group.
Video consigliato:
Percorso guidato
02:35
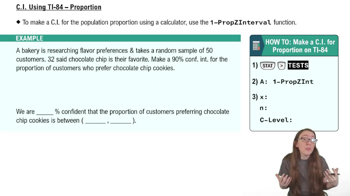
Finding a Confidence Interval for a Population Proportion Using a TI84

Point Estimate

A point estimate is a single value that serves as an approximation of a population parameter. In this case, p^ (p-hat) is the point estimate of the population proportion p, calculated from sample data. It provides a quick and straightforward way to summarize the data, allowing for easier interpretation and communication of results.
Video consigliato:
Percorso guidato
06:33
Introduction to Confidence Intervals

Complement of a Proportion

The complement of a proportion, denoted as q, represents the proportion of the population that does not have the characteristic of interest. In this scenario, q would be the proportion of retired Americans who do not rely on Social Security as a major source of income. Understanding both p and q is essential for a complete analysis of the survey results.
Video consigliato:
Percorso guidato
08:09
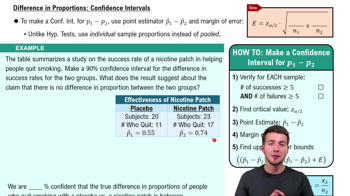
Difference in Proportions: Confidence Intervals