Ch. 10 - Correlation and Regression
Triola - Elementary Statistics 14th Edition
Triola14th EditionElementary StatisticsISBN: 9780137366446Non è quello che usi tu?Cambia libro di testo
Capitolo 10, Problema 10.3.4

Standard Error of Estimate A random sample of 118 different female statistics students is obtained and their weights are measured in kilograms and in pounds. Using the 118 paired weights (weight in kg, weight in lb), what is the value of se? For a female statistics student who weighs 100 lb, the predicted weight in kilograms is 45.4 kg. What is the 95% prediction interval?

Guida verificata passo dopo passo
1
Step 1: Understand the problem. The standard error of estimate (se) measures the accuracy of predictions made by a regression model. It is calculated using the residuals (differences between observed and predicted values). Additionally, the 95% prediction interval provides a range within which we expect the actual value to fall for a given prediction.
Step 2: Calculate the residuals. For each paired observation (weight in kg and weight in lb), subtract the predicted weight in kilograms from the observed weight in kilograms. Residual = Observed weight (kg) - Predicted weight (kg).
Step 3: Compute the standard error of estimate (se). Use the formula: ∑i=1n(Residual)2n-2, where n is the number of paired observations (118 in this case).
Step 4: Determine the 95% prediction interval. Use the formula: Predicted±t×se, where t is the critical value from the t-distribution for a 95% confidence level and degrees of freedom (df = n - 2). Look up the t-value corresponding to df = 116.
Step 5: Apply the prediction interval formula for the given prediction. Substitute the predicted weight in kilograms (45.4 kg), the calculated standard error of estimate (se), and the t-value into the formula to find the lower and upper bounds of the interval.

Risposta video verificata per un problema simile:

Questa soluzione video è stata consigliata dai nostri tutor come utile per risolvere questo problema.
Durata del video:
5m

Concetti chiave

Ecco i concetti essenziali che devi comprendere per rispondere correttamente alla domanda.

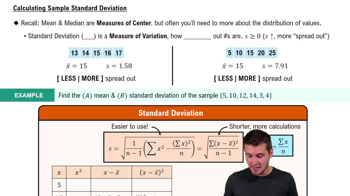
Standard Error of Estimate (SE)

The Standard Error of Estimate quantifies the accuracy of predictions made by a regression model. It measures the average distance that the observed values fall from the regression line. A smaller SE indicates a better fit of the model to the data, meaning predictions are closer to actual values. In this context, it helps assess how well the weight in kilograms can be predicted from the weight in pounds.
Video consigliato:
Percorso guidato
08:45
Calculating Standard Deviation

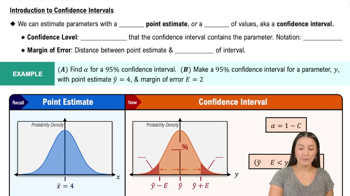
Prediction Interval

A prediction interval provides a range within which we expect a future observation to fall, given a certain level of confidence (e.g., 95%). It accounts for both the uncertainty in the estimate of the mean response and the variability of individual observations. In this scenario, the prediction interval will help determine the range of weights in kilograms for a female statistics student weighing 100 lb, reflecting the inherent variability in the data.
Video consigliato:
Percorso guidato
06:33
Introduction to Confidence Intervals

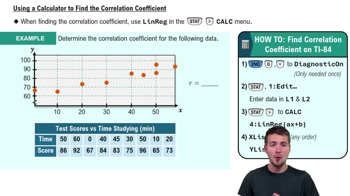
Linear Regression

Linear regression is a statistical method used to model the relationship between a dependent variable and one or more independent variables. It assumes a linear relationship, allowing us to predict the dependent variable based on the values of the independent variables. In this case, it is used to predict the weight in kilograms based on the weight in pounds, forming the basis for calculating the Standard Error of Estimate and the prediction interval.
Video consigliato:
Percorso guidato
04:40
Calculating Correlation Coefficient - Graphing Calculator
Pratica correlata
Domanda del libro di testo

Finding the Best Model

In Exercises 5–16, construct a scatterplot and identify the mathematical model that best fits the given data. Assume that the model is to be used only for the scope of the given data, and consider only linear, quadratic, logarithmic, exponential, and power models.

Richter Scale The table lists different amounts (metric tons) of the explosive TNT and the corresponding value measured on the Richter scale resulting from explosions of the TNT.

25
views
Domanda del libro di testo

Regression and Predictions

Exercises 13–28 use the same data sets as Exercises 13–28 in Section 10-1.


Find the regression equation, letting the first variable be the predictor (x) variable.

Find the indicated predicted value by following the prediction procedure summarized in Figure 10-5.

Subway and the CPI Use the subway/CPI data from the preceding exercise. What is the best predicted value of the CPI when the subway fare is \$3.00?

170
views
Domanda del libro di testo

Interpreting a Computer Display

In Exercises 9–12, refer to the display obtained by using the paired data consisting of weights (pounds) and highway fuel consumption amounts (mi/gal) of the large cars included in Data Set 35 “Car Data” in Appendix B. Along with the paired weights and fuel consumption amounts, StatCrunch was also given the value of 4000 pounds to be used for predicting highway fuel consumption.


[IMAGE]


Predicting Highway Fuel Consumption Using a car weight of x = 4000 (pounds), what is the single value that is the best predicted amount of highway fuel consumption?

114
views
Domanda del libro di testo

Finding the Best Model

In Exercises 5–16, construct a scatterplot and identify the mathematical model that best fits the given data. Assume that the model is to be used only for the scope of the given data, and consider only linear, quadratic, logarithmic, exponential, and power models.

Sound Intensity The table lists intensities of sounds as multiples of a basic reference sound. A scale similar to the decibel scale is used to measure the sound intensity.

123
views
Domanda del libro di testo

Randomization

For Exercises 33–36, repeat the indicated exercise using the resampling method of randomization.

Powerball Jackpots and Tickets Sold Exercise 14

79
views
Domanda del libro di testo

Coefficient of Determination Using the heights and weights described in Exercise 1, the linear correlation coefficient r is 0.394. Find the value of the coefficient of determination. What practical information does the coefficient of determination provide?

237
views