Ch. 6 - Normal Probability Distributions
Triola - Elementary Statistics 14th Edition
Triola14th EditionElementary StatisticsISBN: 9780137366446Non è quello che usi tu?Cambia libro di testo
Capitolo 6, Problema 6.CR.3c

Foot Lengths of Women Assume that foot lengths of adult females are normally distributed with a mean of 246.3 mm and a standard deviation of 12.4 mm (based on Data Set 3 “ANSUR II 2012” in Appendix B).


c. Find P95.

Guida verificata passo dopo passo
1
Step 1: Understand the problem. The question asks for P95, which represents the 95th percentile of a normal distribution. This means we need to find the value of foot length (x) such that 95% of the data lies below it. The distribution is normal with a mean (μ) of 246.3 mm and a standard deviation (σ) of 12.4 mm.
Step 2: Recall the formula for converting a raw score (x) to a z-score in a normal distribution: z = (x - μ) / σ. To find P95, we will reverse this formula to solve for x: x = z * σ + μ.
Step 3: Look up the z-score corresponding to the 95th percentile in a standard normal distribution table or use statistical software. The z-score for the 95th percentile is approximately 1.645.
Step 4: Substitute the known values into the formula x = z * σ + μ. Here, z = 1.645, μ = 246.3 mm, and σ = 12.4 mm. The formula becomes x = (1.645 * 12.4) + 246.3.
Step 5: Simplify the expression to calculate the value of x, which represents P95. This will give the foot length at the 95th percentile.

Risposta video verificata per un problema simile:

Questa soluzione video è stata consigliata dai nostri tutor come utile per risolvere questo problema.
Durata del video:
2m

Concetti chiave

Ecco i concetti essenziali che devi comprendere per rispondere correttamente alla domanda.

Normal Distribution

Normal distribution is a probability distribution that is symmetric about the mean, showing that data near the mean are more frequent in occurrence than data far from the mean. It is characterized by its bell-shaped curve, defined by its mean and standard deviation. In this context, foot lengths of women are assumed to follow a normal distribution, which allows for the application of statistical methods to analyze the data.
Video consigliato:
Percorso guidato
09:47
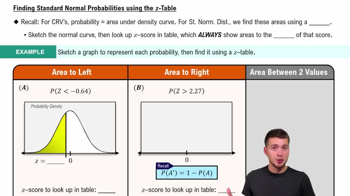
Finding Standard Normal Probabilities using z-Table

Percentiles

A percentile is a measure used in statistics to indicate the value below which a given percentage of observations fall. For example, P95 (the 95th percentile) represents the foot length below which 95% of the adult female population's foot lengths fall. Understanding percentiles is crucial for interpreting data distributions and making comparisons within a dataset.

Z-scores

A Z-score is a statistical measurement that describes a value's relationship to the mean of a group of values, expressed in terms of standard deviations. It is calculated by subtracting the mean from the value and then dividing by the standard deviation. Z-scores are essential for finding percentiles in a normal distribution, as they allow us to determine how far a specific value is from the mean and to use standard normal distribution tables.
Video consigliato:
Percorso guidato
06:31
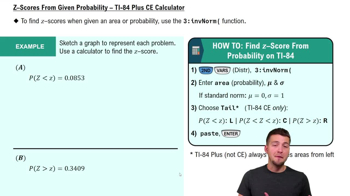
Z-Scores From Given Probability - TI-84 (CE) Calculator
Pratica correlata
Domanda del libro di testo

Basis for the Range Rule of Thumb and the Empirical Rule. In Exercises 45–48, find the indicated area under the curve of the standard normal distribution; then convert it to a percentage and fill in the blank. The results form the basis for the range rule of thumb and the empirical rule introduced in Section 3-2.


About __ % of the area is between z = -3.5 and z = 3.5 (or within 3.5 standard deviation of the mean).

184
views
Domanda del libro di testo

In Exercises 1 and 2, use the following wait times (minutes) at 10:00 AM for the Tower of Terror ride at Disney World (from Data Set 33 “Disney World Wait Times” in Appendix B).


35 35 20 50 95 75 45 50 30 35 30 30


h. Are the wait times discrete data or continuous data?

272
views
Domanda del libro di testo

Foot Lengths of Women Assume that foot lengths of adult females are normally distributed with a mean of 246.3 mm and a standard deviation of 12.4 mm (based on Data Set 3 “ANSUR II 2012” in Appendix B).


a. Find the probability that a randomly selected adult female has a foot length less than 221.5 mm.

149
views
Domanda del libro di testo

Normal Distribution Using a larger data set than the one given for the preceding exercises, assume that cell phone radiation amounts are normally distributed with a mean of 1.17 W/kg and a standard deviation of 0.29 W/kg.

a. Find the probability that a randomly selected cell phone has a radiation amount that exceeds the U.S. standard of 1.6 W/kg or less.

115
views
Domanda del libro di testo

Foot Lengths of Women Assume that foot lengths of adult females are normally distributed with a mean of 246.3 mm and a standard deviation of 12.4 mm (based on Data Set 3 “ANSUR II 2012” in Appendix B).


d. Find the probability that 16 adult females have foot lengths with a mean greater than 250 mm.

108
views
Domanda del libro di testo

In Exercises 1 and 2, use the following wait times (minutes) at 10:00 AM for the Tower of Terror ride at Disney World (from Data Set 33 “Disney World Wait Times” in Appendix B).


35 35 20 50 95 75 45 50 30 35 30 30 


b. Find the median.

132
views