Skip to main content
Statistics for Business
Il mio corso
Impara
Preparazione agli esami
AI Tutor
Guide di studio
Flashcard
Esplora
Prova l'app
Il mio corso
Impara
Preparazione agli esami
AI Tutor
Guide di studio
Flashcard
Esplora
Prova l'app
Indietro
Boxplots definitions
Puoi toccare per girare la carta.
Boxplot
Puoi toccare per girare la carta.
👆
Boxplot
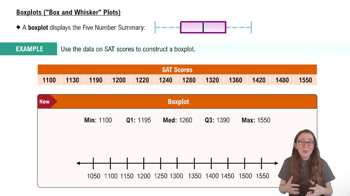
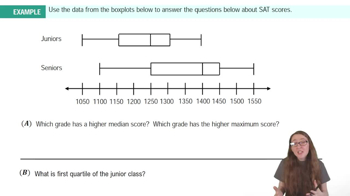
A graphical summary using a box and whiskers to display the distribution, center, and spread of a dataset.
Avanzamenti del tracciato
I pulsanti di controllo sono stati cambiati in modalità "navigazione".
1/12
Flashcard correlate
Pratica correlata
Video consigliati
Boxplots quiz
Boxplots
15 Termini
Boxplots
3. Describing Data Numerically
5 Problemi
Argomento
Ernest
3. Describing Data Numerically
8 Argomenti
19 Problemi
Capitolo
Jonathan
VideoThumbView.guidedCourse
01:52
Boxplots Example 1
296
views
1
rank
VideoThumbView.guidedCourse
03:54
Boxplots ("Box and Whisker Plots")
373
views
2
rank
VideoThumbView.guidedCourse
02:48
Boxplots Example 2
259
views
4
rank
Termini in questo insieme (12)
Nascondere definizioni
Boxplot
A graphical summary using a box and whiskers to display the distribution, center, and spread of a dataset.
Median
The central value dividing a dataset into two equal halves, shown as a line inside the box.
Quartile
A value marking one-fourth or three-fourths of ordered data, used to define the box’s edges.
Interquartile Range
The distance between the first and third quartiles, representing the middle 50% of data.
Whisker
A line extending from the box to the smallest or largest non-outlier value in the dataset.
Outlier
A data point lying outside the whiskers, indicating an unusually high or low value.
Minimum
The smallest data value within the range of the whiskers, excluding outliers.
Maximum
The largest data value within the range of the whiskers, excluding outliers.
Five-Number Summary
A set of values including minimum, first quartile, median, third quartile, and maximum.
Symmetry
A property where the box and whiskers are evenly balanced around the median, indicating similar spread.
Skewness
A measure of asymmetry in the data, visible when the box or whiskers are uneven.
Spread
The extent of data dispersion, visually represented by the length of the box and whiskers.
 IndietroIndietro

 01:52
01:52