Skip to main content
Statistics for Business
Il mio corso
Impara
Preparazione agli esami
AI Tutor
Guide di studio
Flashcard
Esplora
Prova l'app
Il mio corso
Impara
Preparazione agli esami
AI Tutor
Guide di studio
Flashcard
Esplora
Prova l'app
Indietro
Coefficient of Determination quiz
Puoi toccare per girare la carta.
What does the coefficient of determination (R^2) measure in a dataset?
Puoi toccare per girare la carta.
👆
What does the coefficient of determination (R^2) measure in a dataset?
It measures how much of the variation in the dependent variable (y) is explained by the independent variable (x).
Avanzamenti del tracciato
I pulsanti di controllo sono stati cambiati in modalità "navigazione".
1/15
Flashcard correlate
Pratica correlata
Video consigliati
Coefficient of Determination definitions
Coefficient of Determination
14 Termini
Coefficient of Determination
12. Regression
10 Problemi
Argomento
Ally
12. Regression - Part 1 of 2
4 Argomenti
15 Problemi
Capitolo
Ally
12. Regression - Part 2 of 2
2 Argomenti
3 Problemi
Capitolo
Justin
VideoThumbView.guidedCourse
06:14
Coefficient of Determination
242
views
Termini in questo insieme (15)
Nascondere definizioni
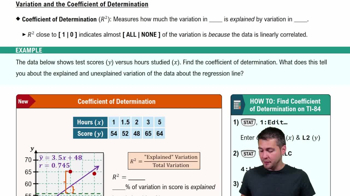
What does the coefficient of determination (R^2) measure in a dataset?
It measures how much of the variation in the dependent variable (y) is explained by the independent variable (x).
How is the coefficient of determination (R^2) related to the linear correlation coefficient (r)?
R^2 is simply the square of the linear correlation coefficient r.
What is the range of possible values for R^2?
R^2 ranges from 0 to 1.
If R^2 is close to 1, what does this indicate about the data?
It indicates that most of the variation in y is explained by the linear relationship with x.
If R^2 is close to 0, what does this indicate about the data?
It means that very little of the variation in y is explained by x; most variation is unexplained.
How do you calculate R^2 if you are given the value of r?
You calculate R^2 by squaring the value of r.
What is the formula for R^2 in terms of variation?
R^2 = explained variation / total variation.
How is explained variation defined in the context of R^2?
Explained variation is the sum of squared distances from the regression line to the mean of y.
How is total variation defined when calculating R^2?
Total variation is the sum of squared distances from each data point to the mean of y.
Why is R^2 always a positive number?
Because it is the square of r, and squaring any real number results in a non-negative value.
How are R^2 values typically expressed in interpretation?
They are usually expressed as percentages, indicating the percent of variation explained.
What does the complement of R^2 represent in a dataset?
It represents the percentage of variation in y that is unexplained by x, due to randomness or other factors.
What does it mean graphically if data points are close to the regression line?
It means R^2 is high, indicating a strong linear relationship.
What does it mean if data points are widely scattered from the regression line?
It means R^2 is low, indicating a weak or no linear relationship.
How can you find R^2 using a graphing calculator?
Input the data, use the linear regression function, and the calculator will display both r and R^2.
 IndietroIndietro

 06:14
06:14