Skip to main content
Statistics for Business
Il mio corso
Impara
Preparazione agli esami
AI Tutor
Guide di studio
Flashcard
Esplora
Prova l'app
Il mio corso
Impara
Preparazione agli esami
AI Tutor
Guide di studio
Flashcard
Esplora
Prova l'app
Indietro
Finding Probabilities and T Critical Values - Excel quiz
Puoi toccare per girare la carta.
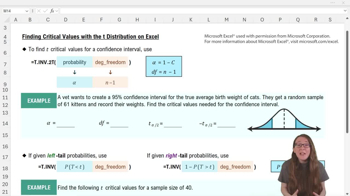
Which Excel function is used to find t critical values for a confidence interval with a two-tail probability?
Puoi toccare per girare la carta.
👆
Which Excel function is used to find t critical values for a confidence interval with a two-tail probability?
The function is t.inv.2t, which requires the combined tail probability (alpha) and degrees of freedom as inputs.
Avanzamenti del tracciato
I pulsanti di controllo sono stati cambiati in modalità "navigazione".
1/15
Flashcard correlate
Pratica correlata
Video consigliati
Finding Probabilities and T Critical Values - Excel definitions
Finding Probabilities and T Critical Values - Excel
15 Termini
7. Sampling Distributions & Confidence Intervals: Mean - Part 1 of 2
3 Argomenti
15 Problemi
Capitolo
Ally
7. Sampling Distributions & Confidence Intervals: Mean - Part 2 of 2
1 Argomento
2 Problemi
Capitolo
Zachary
VideoThumbView.guidedCourse
07:54
Finding Probabilities From t-Scores
113
views
1
rank
VideoThumbView.guidedCourse
08:35
Finding t Critical Values From Probabilities - Excel
193
views
1
rank
VideoThumbView.guidedCourse
04:12
Finding Probabilities From t-Scores Example 1
94
views
Termini in questo insieme (15)
Nascondere definizioni
Which Excel function is used to find t critical values for a confidence interval with a two-tail probability?
The function is t.inv.2t, which requires the combined tail probability (alpha) and degrees of freedom as inputs.
How do you calculate degrees of freedom for the t-distribution in Excel?
Degrees of freedom are calculated as the sample size n minus 1 (n-1).
What is the formula for alpha when constructing a confidence interval?
Alpha is calculated as 1 minus the confidence level (alpha = 1 - confidence level).
How do you obtain the negative t critical value in Excel after finding the positive value?
You can either manually add a negative sign or use Excel to multiply the positive value by -1.
Which Excel function is used to find a t score for a left-tail probability?
The function is t.inv, which takes the left-tail probability and degrees of freedom as inputs.
How do you convert a right-tail probability to a left-tail probability for use in t.inv?
Use the complement rule: left-tail probability = 1 - right-tail probability.
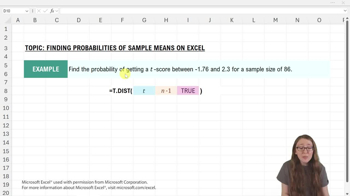
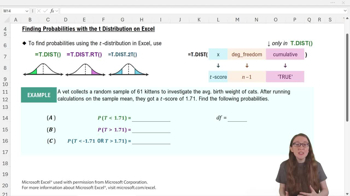
What Excel function is used to find the probability of getting a t score below a certain value?
Use t.dist with the t score, degrees of freedom, and cumulative set to TRUE.
What are the three inputs required for the t.dist function in Excel?
The inputs are the t score, degrees of freedom, and cumulative (always TRUE for left-tail probability).
Which Excel function is used to find the probability of getting a t score above a certain value?
Use t.dist.rt, which requires the t score and degrees of freedom as inputs.
What is the difference in inputs between t.dist and t.dist.rt functions?
t.dist requires three inputs (t score, degrees of freedom, cumulative), while t.dist.rt only requires two (t score and degrees of freedom).
Which Excel function is used to find a two-tail probability for the t-distribution?
Use t.dist.2t, which takes the positive t score and degrees of freedom as inputs.
When using t.dist.2t, which t score should you input if you have both a negative and positive value?
Always input the positive t score; entering the negative value will result in an error.
What does the cumulative argument in t.dist indicate?
Cumulative set to TRUE tells Excel to calculate the cumulative left-tail probability.
What happens if you try to use the cumulative argument in t.dist.rt or t.dist.2t?
You will get an error because these functions only accept two inputs: t score and degrees of freedom.
Why is using Excel advantageous for finding t critical values compared to using tables?
Excel allows you to find critical values for any confidence level and sample size, which is not possible with static tables.
 IndietroIndietro

 07:54
07:54