Skip to main content
Statistics for Business
Il mio corso
Impara
Preparazione agli esami
AI Tutor
Guide di studio
Flashcard
Esplora
Prova l'app
Il mio corso
Impara
Preparazione agli esami
AI Tutor
Guide di studio
Flashcard
Esplora
Prova l'app
Indietro
Frequency Polygons definitions
Puoi toccare per girare la carta.
Frequency Polygon
Puoi toccare per girare la carta.
👆
Frequency Polygon
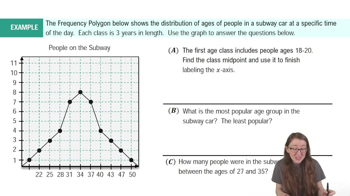
A graph using points connected by segments to display frequencies across classes, offering an alternative to histograms.
Avanzamenti del tracciato
I pulsanti di controllo sono stati cambiati in modalità "navigazione".
1/14
Flashcard correlate
Pratica correlata
Video consigliati
Frequency Polygons quiz
Frequency Polygons
15 Termini
Frequency Polygons
2. Describing Data with Tables and Graphs
10 Problemi
Argomento
Dot Plots
2. Describing Data with Tables and Graphs
10 Problemi
Argomento
Ally
2. Describing Data with Tables and Graphs
10 Argomenti
15 Problemi
Capitolo
David-Paige
VideoThumbView.guidedCourse
04:41
Creating Frequency Polygons
405
views
6
rank
VideoThumbView.guidedCourse
04:15
Example 1
288
views
14
rank
Termini in questo insieme (14)
Nascondere definizioni
Frequency Polygon
A graph using points connected by segments to display frequencies across classes, offering an alternative to histograms.
Histogram
A bar graph representing frequencies for class intervals, with bar heights showing the frequency of each class.
Frequency Distribution
A summary table showing how data values are distributed across different classes or intervals.
Class Midpoint
A value found by averaging the lower and upper limits of a class, used as the x-coordinate for plotting.
Class Interval
A range of values grouped together in a frequency distribution, often defined by lower and upper limits.
Lower Limit
The smallest value included in a class interval, marking its starting boundary.
Upper Limit
The largest value included in a class interval, marking its ending boundary.
Y-Axis
The vertical axis on a graph, representing frequencies in both histograms and frequency polygons.
X-Axis
The horizontal axis on a graph, labeled with class midpoints for frequency polygons and histograms.
Skew
A measure of asymmetry in a distribution, identified by the direction and length of the tails relative to the peak.
Peak
The highest point on a frequency polygon or histogram, indicating the class with the greatest frequency.
Tail
The extended part of a distribution on either side of the peak, used to assess skewness.
Segment
A straight line connecting two plotted points on a frequency polygon, forming its shape.
Line Graph
A graph connecting data points to show trends over time, often confused with frequency polygons but used differently.
 IndietroIndietro

 04:41
04:41