Skip to main content
Statistics for Business
Il mio corso
Impara
Preparazione agli esami
AI Tutor
Guide di studio
Flashcard
Esplora
Prova l'app
Il mio corso
Impara
Preparazione agli esami
AI Tutor
Guide di studio
Flashcard
Esplora
Prova l'app
Indietro
Performing Hypothesis Tests: Means quiz
Puoi toccare per girare la carta.
What is the null hypothesis (H0) in a hypothesis test for means?
Puoi toccare per girare la carta.
👆
What is the null hypothesis (H0) in a hypothesis test for means?
The null hypothesis states that the population mean equals a specific value, such as H0: μ = 25,000.
Avanzamenti del tracciato
I pulsanti di controllo sono stati cambiati in modalità "navigazione".
1/15
Flashcard correlate
Pratica correlata
Video consigliati
Performing Hypothesis Tests: Means definitions
Performing Hypothesis Tests: Means
15 Termini
Performing Hypothesis Tests: Means
9. Hypothesis Testing for One Sample
10 Problemi
Argomento
Laura
9. Hypothesis Testing for One Sample - Part 1 of 2
3 Argomenti
15 Problemi
Capitolo
Brendan
9. Hypothesis Testing for One Sample - Part 2 of 2
3 Argomenti
9 Problemi
Capitolo
Brendan
VideoThumbView.guidedCourse
04:53
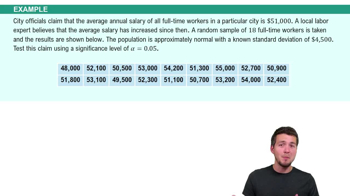
Standard Deviation (σ) Known Example 2
194
views
1
rank
VideoThumbView.guidedCourse
06:51
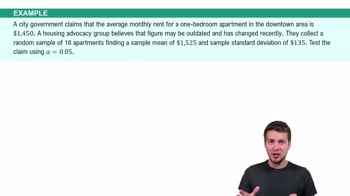
Standard Deviation (σ) Known Example 3
176
views
2
rank
VideoThumbView.guidedCourse
06:13
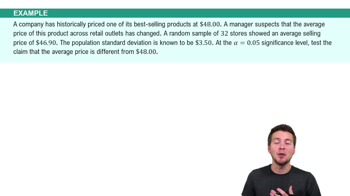
Standard Deviation (σ) Unknown Example 4
188
views
Termini in questo insieme (15)
Nascondere definizioni
What is the null hypothesis (H0) in a hypothesis test for means?
The null hypothesis states that the population mean equals a specific value, such as H0: μ = 25,000.
When should you use a z-test instead of a t-test in hypothesis testing for means?
A z-test is used when the population standard deviation (σ) is known; a t-test is used when σ is unknown.
What does the alternative hypothesis (Ha) represent in a hypothesis test?
The alternative hypothesis suggests a different claim about the population mean, such as Ha: μ < 25,000.
How do you calculate the test statistic for a z-test?
The z-test statistic is calculated as (sample mean - population mean) divided by (σ / sqrt(n)).
What is the formula for the t-test statistic when σ is unknown?
The t-test statistic is (sample mean - population mean) divided by (s / sqrt(n)), where s is the sample standard deviation.
What is the significance level (alpha) in hypothesis testing?
Alpha (α) is the threshold probability for rejecting the null hypothesis, commonly set at 0.05 or 0.1.
What does the p-value represent in hypothesis testing?
The p-value is the probability of observing the sample data, or more extreme, assuming the null hypothesis is true.
What is the decision rule for rejecting the null hypothesis based on the p-value?
If the p-value is less than alpha, we reject the null hypothesis; otherwise, we fail to reject it.
What are the criteria for using a z-test or t-test for means?
You need a random sample and either a normal distribution or a sample size greater than 30.
How do you determine the direction of the test (left, right, or two-tailed)?
The direction depends on the alternative hypothesis: '<' for left-tailed, '>' for right-tailed, and '≠' for two-tailed.
What is the role of degrees of freedom in a t-test?
Degrees of freedom for a t-test is n - 1, where n is the sample size, and it is used to find the p-value.
How do you use a TI-84 calculator to perform a z-test for means?
Select the Z-Test function, input the population mean, σ, sample mean, sample size, and choose the correct alternative hypothesis.
What information do you need to perform a t-test on a TI-84 calculator?
You need the sample mean, sample standard deviation, sample size, and the hypothesized population mean.
What does it mean if the p-value is greater than alpha in a hypothesis test?
If p-value > alpha, we fail to reject the null hypothesis, indicating insufficient evidence for the alternative hypothesis.
Why is it important to check if the sample is random and the distribution is normal or n > 30?
These conditions ensure the validity of the hypothesis test and allow the use of z or t distributions.
 IndietroIndietro

 04:53
04:53