Skip to main content
Statistics for Business
Il mio corso
Impara
Preparazione agli esami
AI Tutor
Guide di studio
Flashcard
Esplora
Prova l'app
Il mio corso
Impara
Preparazione agli esami
AI Tutor
Guide di studio
Flashcard
Esplora
Prova l'app
Indietro
Two Variances - Graphing Calculator quiz
Puoi toccare per girare la carta.
What is the purpose of a two-sample F-test for variance?
Puoi toccare per girare la carta.
👆
What is the purpose of a two-sample F-test for variance?
It is used to compare the variances (or standard deviations) of two populations to test if one is significantly greater than the other.
Avanzamenti del tracciato
I pulsanti di controllo sono stati cambiati in modalità "navigazione".
1/15
Flashcard correlate
Pratica correlata
Video consigliati
Two Variances - Graphing Calculator definitions
Two Variances - Graphing Calculator
15 Termini
Two Variances and F Distribution
10. Hypothesis Testing for Two Samples
5 Problemi
Argomento
Justin
10. Hypothesis Testing for Two Samples - Part 1 of 2
3 Argomenti
15 Problemi
Capitolo
Ally
10. Hypothesis Testing for Two Samples - Part 2 of 2
3 Argomenti
8 Problemi
Capitolo
Justin
VideoThumbView.guidedCourse
04:10
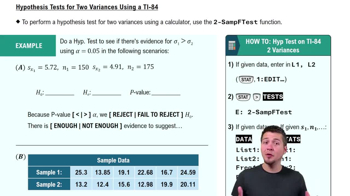
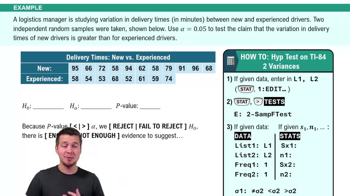
Hypothesis Test for Two Variances Using a TI-84 Example 1
88
views
VideoThumbView.guidedCourse
07:07
Hypothesis Test for Two Variances Using a TI-84
111
views
Termini in questo insieme (15)
Nascondere definizioni
What is the purpose of a two-sample F-test for variance?
It is used to compare the variances (or standard deviations) of two populations to test if one is significantly greater than the other.
Which function on a graphing calculator is used to perform a two-sample F-test?
The 'two sample F test' function is used to perform this test on a graphing calculator.
What are the two main values you obtain from the two-sample F-test output?
You obtain the F statistic and the p-value from the test output.
When given only sample statistics, which values must you input into the calculator for the two-sample F-test?
You must input the sample standard deviations (s1 and s2) and the sample sizes (n1 and n2).
What is the null hypothesis (H0) when testing if sigma1 is greater than sigma2?
The null hypothesis is that sigma1 equals sigma2.
How do you decide which sample is s1 and which is s2 when entering values?
s1 should be the larger standard deviation, and s2 the smaller, unless otherwise labeled.
What does it mean if the p-value is less than the chosen alpha level (e.g., 0.05)?
It means you reject the null hypothesis and conclude there is enough evidence that sigma1 is greater than sigma2.
What should you do if the p-value is greater than alpha?
You fail to reject the null hypothesis, indicating insufficient evidence that sigma1 is greater than sigma2.
When entering raw data for the two-sample F-test, where should you input the data in the calculator?
You should enter the data into lists, typically L1 and L2, for sample one and sample two, respectively.
What menu path do you follow on the calculator to access the two-sample F-test?
Go to the 'stat' menu, then the 'tests' tab, and select 'two sample F test.'
What alternative hypothesis do you select if you are testing if sigma1 is greater than sigma2?
You select the right-tailed alternative hypothesis (sigma1 > sigma2).
Why is it important to write down the F statistic even if not required?
It is good practice for clarity and helps in interpreting the test results.
What does rejecting the null hypothesis in a two-sample F-test allow you to conclude?
It allows you to conclude that there is sufficient evidence that the variance or standard deviation of one sample exceeds the other.
If you are given raw data instead of summary statistics, what is the first step before running the F-test?
The first step is to enter the raw data into the calculator's lists (e.g., L1 and L2).
What is the significance of the alpha level in hypothesis testing?
The alpha level is the threshold for significance; it determines when you reject the null hypothesis based on the p-value.
 IndietroIndietro

 04:10
04:10