Skip to main content
Statistics for Business
Il mio corso
Impara
Preparazione agli esami
AI Tutor
Guide di studio
Flashcard
Esplora
Prova l'app
Il mio corso
Impara
Preparazione agli esami
AI Tutor
Guide di studio
Flashcard
Esplora
Prova l'app
Indietro
Uniform Distribution definitions
Puoi toccare per girare la carta.
Continuous Random Variable
Puoi toccare per girare la carta.
👆
Continuous Random Variable
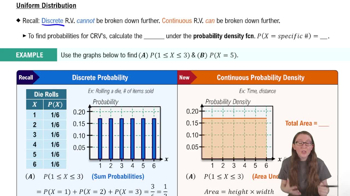
A variable that can assume any value within a given range, with infinitely many possible outcomes between any two points.
Avanzamenti del tracciato
I pulsanti di controllo sono stati cambiati in modalità "navigazione".
1/15
Flashcard correlate
Pratica correlata
Video consigliati
Uniform Distribution quiz
Uniform Distribution
15 Termini
Uniform Distribution
6. Normal Distribution & Continuous Random Variables
7 Problemi
Argomento
Ernest
Standard Normal Distribution
6. Normal Distribution & Continuous Random Variables
10 Problemi
Argomento
Ernest
6. Normal Distribution & Continuous Random Variables
4 Argomenti
15 Problemi
Capitolo
Ernest
VideoThumbView.guidedCourse
02:50
Uniform Distribution Example 1
350
views
12
rank
VideoThumbView.guidedCourse
06:06
Uniform Distribution
647
views
6
rank
Termini in questo insieme (15)
Nascondere definizioni
Continuous Random Variable
A variable that can assume any value within a given range, with infinitely many possible outcomes between any two points.
Discrete Random Variable
A variable with a countable set of possible values, often represented in tables or bar graphs with gaps between values.
Probability Density Function
A function describing how probability is distributed over a range of values for a continuous random variable.
Uniform Distribution
A distribution where the probability density is constant across all values within a specified interval.
Area Under the Curve
The graphical representation of probability for a continuous random variable over a specific interval.
Interval
A continuous range of values between two endpoints, used to calculate probabilities for continuous variables.
Height
The value of the probability density function at a specific point, representing density rather than probability.
Width
The length of the interval on the x-axis over which probability is calculated for continuous variables.
Total Probability
The sum of all probabilities for a random variable, equal to one for both discrete and continuous cases.
Rectangle
The geometric shape formed under the probability density function in a uniform distribution, used to find probabilities.
Graph
A visual tool for representing the distribution of random variables, showing possible values and their probabilities or densities.
Table
A structured format listing possible values of a discrete random variable alongside their probabilities.
Range
The set of all possible values a random variable can take, bounded by minimum and maximum endpoints.
Probability
A measure of the likelihood that a random variable falls within a specified interval or set of values.
Bar Graph
A chart displaying probabilities of discrete random variables as bars, with gaps indicating unavailable values.
 IndietroIndietro
 02:50
02:50