Skip to main content
Calculus
Il mio corso
Impara
Preparazione agli esami
AI Tutor
Guide di studio
Soluzioni per libri di testo
Flashcard
Esplora
Prova l'app
Il mio corso
Impara
Preparazione agli esami
AI Tutor
Guide di studio
Soluzioni per libri di testo
Flashcard
Esplora
Prova l'app
Indietro
Curve Sketching definitions
Puoi toccare per girare la carta.
Domain
Puoi toccare per girare la carta.
👆
Domain
Set of all possible input values for which a function is defined, often spanning from negative to positive infinity for polynomials.
Avanzamenti del tracciato
I pulsanti di controllo sono stati cambiati in modalità "navigazione".
1/15
Flashcard correlate
Pratica correlata
Video consigliati
Curve Sketching quiz
Curve Sketching
15 Termini
Curve Sketching
5. Graphical Applications of Derivatives
3 Problemi
Argomento
Justin
Applied Optimization
5. Graphical Applications of Derivatives
4 Problemi
Argomento
Ernest
5. Graphical Applications of Derivatives
7 Argomenti
13 Problemi
Capitolo
Ernest
11:41
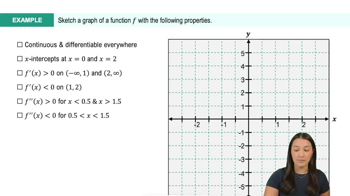
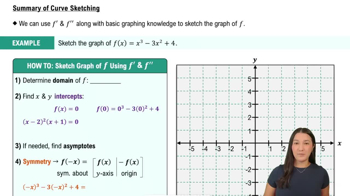
Summary of Curve Sketching
1209
views
21
rank
06:22
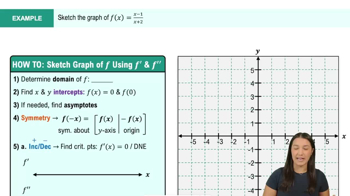
Summary of Curve Sketching Example 3
547
views
12
rank
13:20
Summary of Curve Sketching Example 1
791
views
12
rank
Termini in questo insieme (15)
Nascondere definizioni
Domain
Set of all possible input values for which a function is defined, often spanning from negative to positive infinity for polynomials.
X-intercept
Point where a graph crosses the horizontal axis, found by setting the function equal to zero and solving for the variable.
Y-intercept
Point where a graph crosses the vertical axis, determined by evaluating the function at zero.
Asymptote
Line that a graph approaches but never touches; absent in basic polynomial graphs.
Symmetry
Property describing whether a graph mirrors across an axis or the origin, checked by substituting negative inputs.
First Derivative
Expression indicating the rate of change of a function, used to identify intervals of increase or decrease.
Critical Point
Location where the first derivative equals zero or is undefined, marking potential extrema or inflection.
Sign Chart
Table or diagram used to organize intervals and test values to determine where a function increases or decreases.
Second Derivative
Expression describing the curvature of a function, revealing concavity and possible inflection points.
Concavity
Shape characteristic of a graph, indicating whether it bends upward like a smile or downward like a frown.
Inflection Point
Location where a graph changes concavity, found where the second derivative equals zero or is undefined.
Local Maximum
Peak point on a graph where the function changes from increasing to decreasing, identified via derivative sign change.
Local Minimum
Valley point on a graph where the function changes from decreasing to increasing, marked by a derivative sign change.
First Derivative Test
Method using sign changes of the first derivative around critical points to classify extrema.
Factoring
Process of rewriting a polynomial as a product of simpler expressions, aiding in finding intercepts and critical points.
 IndietroIndietro
 11:41
11:41