Ch. 2 - Limits
Briggs - Calculus: Early Transcendentals 3rd Edition
Briggs3rd EditionCalculus: Early TranscendentalsISBN: 9780136847243Non è quello che usi tu?Cambia libro di testo
Capitolo 2, Problema 82a

Consider the graph of y=cot^−1 x(see Section 1.4) and determine the following limits using the graph.
lim x→∞ cot^−1

Guida verificata passo dopo passo
1
Identify the function: The function given is \( y = \cot^{-1}(x) \), which is the inverse cotangent function.
Understand the behavior of \( \cot^{-1}(x) \): As \( x \to \infty \), the inverse cotangent function approaches a specific value.
Recall the range of \( \cot^{-1}(x) \): The range of \( \cot^{-1}(x) \) is \((0, \pi)\).
Analyze the limit: As \( x \to \infty \), the value of \( \cot^{-1}(x) \) approaches the lower bound of its range.
Conclude the limit: Based on the behavior of the inverse cotangent function, determine the limit as \( x \to \infty \).

Risposta video verificata per un problema simile:

Questa soluzione video è stata consigliata dai nostri tutor come utile per risolvere questo problema.
Durata del video:
1m

Concetti chiave

Ecco i concetti essenziali che devi comprendere per rispondere correttamente alla domanda.

Inverse Cotangent Function

The inverse cotangent function, denoted as cot^−1(x), is the function that returns the angle whose cotangent is x. It is defined for all real numbers and has a range of (0, π). Understanding this function is crucial for analyzing its behavior and limits, especially as x approaches infinity.
Video consigliato:
06:35
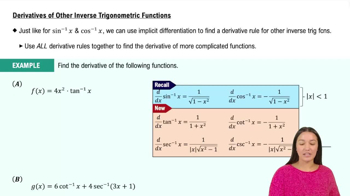
Derivatives of Other Inverse Trigonometric Functions

Limits in Calculus

Limits are fundamental concepts in calculus that describe the behavior of a function as its input approaches a certain value. In this context, evaluating the limit of cot^−1(x) as x approaches infinity helps determine the horizontal asymptote of the function, which is essential for understanding its long-term behavior.
Video consigliato:
05:50
One-Sided Limits

Graphical Interpretation of Limits

Graphical interpretation of limits involves analyzing the graph of a function to determine its behavior as the input approaches a specific value. For cot^−1(x), examining the graph as x approaches infinity allows us to visually assess the limit and understand how the function behaves at extreme values.
Video consigliato:
6:47
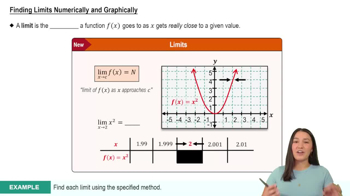
Finding Limits Numerically and Graphically