Ch. 2 - Limits
Briggs - Calculus: Early Transcendentals 3rd Edition
Briggs3rd EditionCalculus: Early TranscendentalsISBN: 9780136847243Non è quello che usi tu?Cambia libro di testo
Capitolo 2, Problema 2.12b

Graph the function f(x)=e^−x / x(x+2)^2 using a graphing utility. (Experiment with your choice of a graphing window.) Use your graph to determine the following limits.


b. lim x→−2 f(x)

Guida verificata passo dopo passo
1
Identify the function: \( f(x) = \frac{e^{-x}}{x(x+2)^2} \).
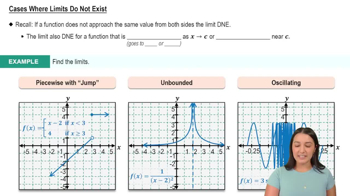
Recognize that the limit \( \lim_{x \to -2} f(x) \) involves a point where the denominator becomes zero, indicating a potential vertical asymptote or removable discontinuity.
Analyze the behavior of the function as \( x \) approaches \(-2\) from both the left and the right to determine if the limit exists.
Consider the sign and magnitude of the numerator \( e^{-x} \) and the denominator \( x(x+2)^2 \) as \( x \to -2^- \) and \( x \to -2^+ \).
Use a graphing utility to visualize the function near \( x = -2 \) to confirm the behavior and determine if the limit exists or if there is a vertical asymptote.

Risposta video verificata per un problema simile:

Questa soluzione video è stata consigliata dai nostri tutor come utile per risolvere questo problema.
Durata del video:
2m

Concetti chiave

Ecco i concetti essenziali che devi comprendere per rispondere correttamente alla domanda.

Limits

A limit is a fundamental concept in calculus that describes the behavior of a function as its input approaches a certain value. It helps in understanding the function's behavior near points of interest, including points of discontinuity or where the function may not be explicitly defined. Evaluating limits is crucial for determining the continuity and differentiability of functions.
Video consigliato:
05:50
One-Sided Limits

Graphing Functions

Graphing functions involves plotting the values of a function on a coordinate system to visualize its behavior. This process can reveal important features such as intercepts, asymptotes, and intervals of increase or decrease. Using a graphing utility allows for experimentation with different viewing windows, which can help in identifying the limits and overall shape of the function.
Video consigliato:
Percorso guidato
5:53
Graph of Sine and Cosine Function

Asymptotic Behavior

Asymptotic behavior refers to how a function behaves as it approaches a certain point, particularly at infinity or near points of discontinuity. In the context of limits, understanding asymptotic behavior is essential for determining the value of a limit as the input approaches a specific value, such as -2 in this case. It often involves analyzing the function's growth rates and identifying any vertical or horizontal asymptotes.
Video consigliato:
03:07
Cases Where Limits Do Not Exist