Ch. 2 - Limits
Briggs - Calculus: Early Transcendentals 3rd Edition
Briggs3rd EditionCalculus: Early TranscendentalsISBN: 9780136847243Non è quello che usi tu?Cambia libro di testo
Capitolo 2, Problema 4j

Use the graph of f in the figure to evaluate the function or analyze the limit. <IMAGE>
lim x→3 f(x)

Guida verificata passo dopo passo
1
Identify the point of interest, which is x = 3, on the graph of the function f(x).
Observe the behavior of the function as x approaches 3 from both the left (x → 3^-) and the right (x → 3^+).
Check if the values of f(x) from the left and right sides are approaching the same value as x approaches 3.
If the left-hand limit and the right-hand limit are equal, then the limit exists and is equal to that common value.
If the left-hand limit and the right-hand limit are not equal, then the limit does not exist.

Risposta video verificata per un problema simile:

Questa soluzione video è stata consigliata dai nostri tutor come utile per risolvere questo problema.
Durata del video:
3m

Concetti chiave

Ecco i concetti essenziali che devi comprendere per rispondere correttamente alla domanda.

Limits

A limit is a fundamental concept in calculus that describes the behavior of a function as its input approaches a certain value. It helps in understanding how functions behave near specific points, even if they are not defined at those points. For example, evaluating the limit of f(x) as x approaches 3 involves determining the value that f(x) approaches as x gets closer to 3.
Video consigliato:
05:50
One-Sided Limits

Continuity

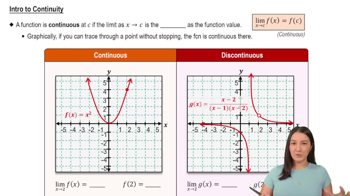
Continuity refers to a property of a function where it is uninterrupted and has no breaks, jumps, or holes at a given point. A function is continuous at a point if the limit as x approaches that point equals the function's value at that point. Understanding continuity is crucial for evaluating limits, as discontinuities can affect the limit's existence and value.
Video consigliato:
05:34
Intro to Continuity

Graphical Analysis

Graphical analysis involves interpreting the visual representation of a function to understand its behavior, including limits and continuity. By examining the graph of f(x), one can identify trends, such as approaching values and discontinuities, which are essential for evaluating limits. This method provides intuitive insights that complement algebraic calculations.
Video consigliato:
Percorso guidato
06:29
Derivatives Applied To Velocity