Ch. 2 - Limits
Briggs - Calculus: Early Transcendentals 3rd Edition
Briggs3rd EditionCalculus: Early TranscendentalsISBN: 9780136847243Non è quello che usi tu?Cambia libro di testo
Capitolo 2, Problema 4a

Use the graph of f in the figure to evaluate the function or analyze the limit. <IMAGE>
f(−1)

Guida verificata passo dopo passo
1
Identify the point on the graph where x = -1.
Observe the y-coordinate of the point on the graph at x = -1.
The y-coordinate at this point is the value of the function f(-1).
If the graph is continuous at x = -1, the y-coordinate directly gives f(-1).
If there is a discontinuity, check if there is a defined value or if it is undefined.

Risposta video verificata per un problema simile:

Questa soluzione video è stata consigliata dai nostri tutor come utile per risolvere questo problema.
Durata del video:
2m

Concetti chiave

Ecco i concetti essenziali che devi comprendere per rispondere correttamente alla domanda.

Function Evaluation

Function evaluation involves determining the output of a function for a specific input value. In this case, evaluating f(−1) means finding the value of the function f at x = -1. This requires understanding the function's definition or its graphical representation to identify the corresponding y-value.
Video consigliato:
Percorso guidato
4:26
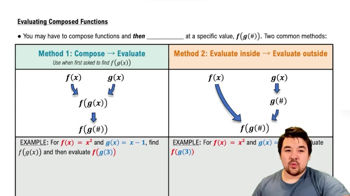
Evaluating Composed Functions

Graph Interpretation

Graph interpretation is the ability to read and analyze a function's graph to extract information about its behavior. This includes identifying points, slopes, and trends. For the question, one must look at the graph to locate the point where x = -1 and determine the value of f at that point.
Video consigliato:
Percorso guidato
06:15
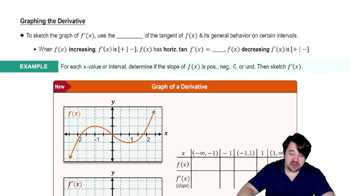
Graphing The Derivative

Limits

Limits describe the behavior of a function as the input approaches a certain value. While the question specifically asks for f(−1), understanding limits is crucial for analyzing the function's behavior near that point, especially if the function is not defined at x = -1 or if there are discontinuities present in the graph.
Video consigliato:
05:50
One-Sided Limits