Ch. 2 - Limits
Briggs - Calculus: Early Transcendentals 3rd Edition
Briggs3rd EditionCalculus: Early TranscendentalsISBN: 9780136847243Non è quello che usi tu?Cambia libro di testo
Capitolo 2, Problema 17a

Use the graph of f in the figure to find the following values or state that they do not exist. If a limit does not exist, explain why. <IMAGE>


a. f(1)

Guida verificata passo dopo passo
1
Step 1: Understand the problem. We need to find the value of the function f at x = 1, denoted as f(1).
Step 2: Since the problem refers to a graph, locate the point on the graph where x = 1.
Step 3: Observe the y-coordinate of the point on the graph where x = 1. This y-coordinate is the value of f(1).
Step 4: If the graph has a point at x = 1, then f(1) is the y-coordinate of that point. If there is a hole or no point at x = 1, then f(1) does not exist.
Step 5: Conclude by stating the value of f(1) based on the graph observation or state that it does not exist if there is no point at x = 1.

Risposta video verificata per un problema simile:

Questa soluzione video è stata consigliata dai nostri tutor come utile per risolvere questo problema.
Durata del video:
1m

Concetti chiave

Ecco i concetti essenziali che devi comprendere per rispondere correttamente alla domanda.

Function Evaluation

Function evaluation involves determining the output of a function for a specific input value. In this case, f(1) means finding the value of the function f at x = 1. This requires understanding the function's definition or its graphical representation to identify the corresponding y-value.
Video consigliato:
Percorso guidato
4:26
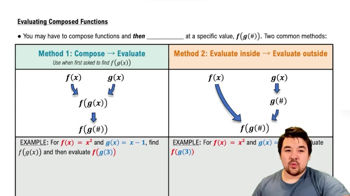
Evaluating Composed Functions

Limits

A limit describes the behavior of a function as the input approaches a certain value. It is crucial for understanding continuity and the existence of function values at specific points. If a limit does not exist, it may be due to a discontinuity, such as a jump or vertical asymptote in the graph.
Video consigliato:
05:50
One-Sided Limits

Graphical Interpretation

Graphical interpretation involves analyzing the visual representation of a function to extract information about its behavior. This includes identifying points of interest, such as intercepts, maxima, minima, and discontinuities, which are essential for answering questions about function values and limits.
Video consigliato:
05:02
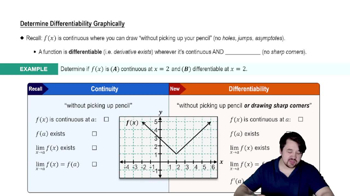
Determining Differentiability Graphically