Ch. 3 - Derivatives
Briggs - Calculus: Early Transcendentals 3rd Edition
Briggs3rd EditionCalculus: Early TranscendentalsISBN: 9780136847243Non è quello che usi tu?Cambia libro di testo
Capitolo 3, Problema 77a

Graph the function f(x)={x        if x≤0x+1 if x>0f(x)=\(\begin{cases}\)x~~~~~~~~\(\text{if}\)~x\(\leq{0}\[\x\)+1~\(\text{if}\)~x\(\gt{0}\]\end{cases}\).

Guida verificata passo dopo passo
1
Step 1: Understand the piecewise function. The function f(x) is defined in two parts: f(x) = x for x ≤ 0 and f(x) = x + 1 for x > 0.
Step 2: Graph the first part of the function, f(x) = x, for x ≤ 0. This is a straight line through the origin with a slope of 1, but only for x-values less than or equal to 0.
Step 3: Graph the second part of the function, f(x) = x + 1, for x > 0. This is a straight line with a slope of 1, starting at the point (0, 1) and continuing for x-values greater than 0.
Step 4: Identify the point of transition at x = 0. For x = 0, the function value is 0 from the first part, so the point (0, 0) is included in the graph.
Step 5: Combine the two parts on the same set of axes. Ensure the graph is continuous at x = 0, with a closed circle at (0, 0) and an open circle at (0, 1) to indicate the transition between the two parts.

Risposta video verificata per un problema simile:

Questa soluzione video è stata consigliata dai nostri tutor come utile per risolvere questo problema.
Durata del video:
3m

Concetti chiave

Ecco i concetti essenziali che devi comprendere per rispondere correttamente alla domanda.

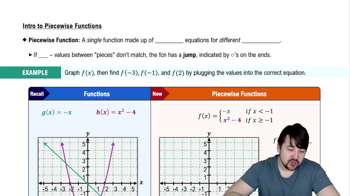
Piecewise Functions

A piecewise function is defined by different expressions based on the input value. In this case, the function f(x) has two cases: for x less than or equal to 0, it equals x, and for x greater than 0, it equals x + 1. Understanding how to evaluate and graph these distinct segments is crucial for visualizing the overall function.
Video consigliato:
Percorso guidato
05:36
Piecewise Functions

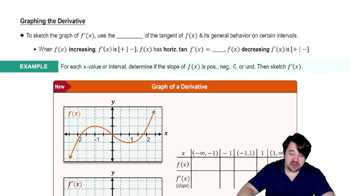
Graphing Techniques

Graphing techniques involve plotting points and understanding the behavior of functions across different intervals. For piecewise functions, it is essential to identify the points where the function changes its definition, ensuring that the graph accurately reflects the function's behavior at those transition points.
Video consigliato:
Percorso guidato
06:15
Graphing The Derivative

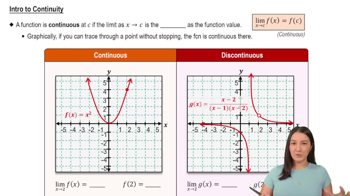
Continuity and Discontinuity

Continuity refers to a function being unbroken and having no gaps in its graph. In the case of the given piecewise function, it is important to check if the function is continuous at x = 0, where the definition changes. Analyzing limits and function values at this point helps determine if there is a jump or removable discontinuity.
Video consigliato:
05:34
Intro to Continuity