Ch. 3 - Derivatives
Briggs - Calculus: Early Transcendentals 3rd Edition
Briggs3rd EditionCalculus: Early TranscendentalsISBN: 9780136847243Non è quello che usi tu?Cambia libro di testo
Capitolo 3, Problema 3.R.99a

The population of the United States (in millions) by decade is given in the table, where t is the number of years after 1910. These data are plotted and fitted with a smooth curve y = p(t) in the figure. <IMAGE><IMAGE>
Compute the average rate of population growth from 1950 to 1960. 

Guida verificata passo dopo passo
1
Identify the years corresponding to 1950 and 1960 in terms of t, where t is the number of years after 1910. For 1950, t = 40, and for 1960, t = 50.
Find the population values from the table or the smooth curve y = p(t) for t = 40 and t = 50. Let's denote these populations as P(40) and P(50) respectively.
The average rate of population growth over a time interval [a, b] is given by the formula: \( \frac{P(b) - P(a)}{b - a} \). In this case, a = 40 and b = 50.
Substitute the values of P(50) and P(40) into the formula: \( \frac{P(50) - P(40)}{50 - 40} \).
Simplify the expression to find the average rate of population growth in millions per year over the decade from 1950 to 1960.

Risposta video verificata per un problema simile:

Questa soluzione video è stata consigliata dai nostri tutor come utile per risolvere questo problema.
Durata del video:
3m

Concetti chiave

Ecco i concetti essenziali che devi comprendere per rispondere correttamente alla domanda.

Average Rate of Change

The average rate of change of a function over an interval measures how much the function's value changes per unit of input over that interval. It is calculated as the difference in the function's values at the endpoints of the interval divided by the difference in the input values. In this context, it represents the average population growth per year from 1950 to 1960.
Video consigliato:
Percorso guidato
06:37
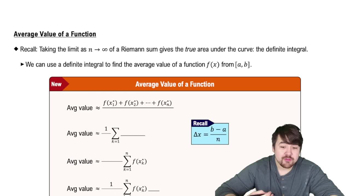
Average Value of a Function

Population Function

The population function, denoted as p(t), represents the population of the United States as a function of time, where t is the number of years since 1910. This function can be derived from the data provided and is typically modeled using polynomial or exponential functions to fit the historical population data. Understanding this function is crucial for calculating changes in population over specific time intervals.
Video consigliato:
Percorso guidato
06:21
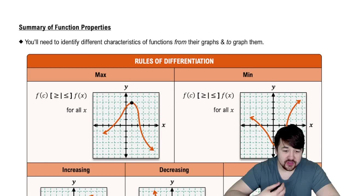
Properties of Functions

Definite Integral

A definite integral calculates the accumulation of quantities, such as population growth, over a specified interval. In this case, while the average rate of change can be computed directly, the definite integral can also be used to find the total change in population over the decade. This concept is foundational in calculus for understanding how functions behave over intervals and is often used in applications involving growth rates.
Video consigliato:
Percorso guidato
05:43
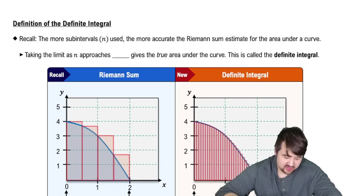
Definition of the Definite Integral