Ch. 3 - Derivatives
Briggs - Calculus: Early Transcendentals 3rd Edition
Briggs3rd EditionCalculus: Early TranscendentalsISBN: 9780136847243Non è quello che usi tu?Cambia libro di testo
Capitolo 3, Problema 3.R.96b

{Use of Tech} Beak length The length of the culmen (the upper ridge of a bird’s bill) of a t-week-old Indian spotted owlet is modeled by the function L(t)=11.94 / 1 + 4e^−1.65t, where L is measured in millimeters.
b. Use a graph of L′(t) to describe how the culmen grows over the first 5 weeks of life.

Guida verificata passo dopo passo
1
First, understand that L(t) is a function that models the length of the culmen of an owlet over time. The function is given as L(t) = \(\frac{11.94}{1 + 4e^{-1.65t}}\). Our task is to analyze the growth rate of the culmen by examining the derivative L'(t).
To find L'(t), we need to differentiate L(t) with respect to t. This involves using the quotient rule for differentiation, which is given by \(\frac{d}{dt}\left(\frac{u}{v}\right) = \frac{v \cdot u' - u \cdot v'}{v^2}\), where u = 11.94 and v = 1 + 4e^{-1.65t}.
Calculate the derivatives u' and v'. Since u is a constant, u' = 0. For v, use the chain rule to find v' = \(-4 \cdot (-1.65) \cdot e^{-1.65t}\). Simplify this to v' = 6.6e^{-1.65t}.
Substitute u, u', v, and v' into the quotient rule formula to find L'(t). This will give you the expression for the rate of change of the culmen length with respect to time.
Finally, use a graphing tool to plot L'(t) over the interval from t = 0 to t = 5. Analyze the graph to describe how the growth rate of the culmen changes over the first 5 weeks. Look for trends such as increasing, decreasing, or constant growth rates.

Risposta video verificata per un problema simile:

Questa soluzione video è stata consigliata dai nostri tutor come utile per risolvere questo problema.
Durata del video:
5m

Concetti chiave

Ecco i concetti essenziali che devi comprendere per rispondere correttamente alla domanda.

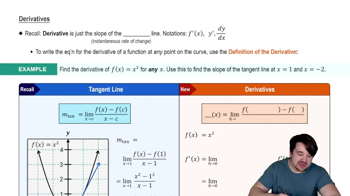
Derivative

The derivative of a function measures the rate at which the function's value changes as its input changes. In this context, L'(t) represents the growth rate of the culmen length over time, indicating how quickly the length is increasing or decreasing at any given moment.
Video consigliato:

Graphing Functions

Graphing functions involves plotting the values of a function on a coordinate system to visualize its behavior. For L'(t), the graph will show how the growth rate of the culmen changes over the first five weeks, helping to identify periods of rapid growth or stagnation.
Video consigliato:
Percorso guidato
5:53
Graph of Sine and Cosine Function

Exponential Functions

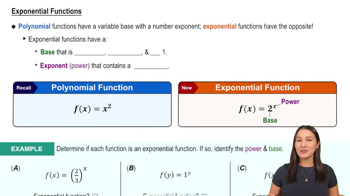
Exponential functions are characterized by a constant base raised to a variable exponent, often representing growth or decay processes. The function L(t) includes an exponential term, which influences the growth pattern of the culmen length, particularly in the early stages of the owlet's life.
Video consigliato:
6:13
Exponential Functions