Ch. 3 - Derivatives
Briggs - Calculus: Early Transcendentals 3rd Edition
Briggs3rd EditionCalculus: Early TranscendentalsISBN: 9780136847243Non è quello che usi tu?Cambia libro di testo
Capitolo 3, Problema 3.6.54a

{Use of Tech} Fuel economy Suppose you own a fuel-efficient hybrid automobile with a monitor on the dashboard that displays the mileage and gas consumption. The number of miles you can drive with g gallons of gas remaining in the tank on a particular stretch of highway is given by m(g) = 50g−25.8g²+12.5g³−1.6g⁴, for 0≤g≤4.
a. Graph and interpret the mileage function.

Guida verificata passo dopo passo
1
To graph the mileage function m(g) = 50g - 25.8g^2 + 12.5g^3 - 1.6g^4, first identify the domain of the function, which is 0 ≤ g ≤ 4. This means we will only consider values of g within this interval.
Next, calculate key points of the function within the domain. This includes finding the value of m(g) at the endpoints g = 0 and g = 4, as well as any critical points where the derivative m'(g) = 0, which will help identify local maxima or minima.
To find the critical points, take the derivative of m(g) with respect to g: m'(g) = 50 - 51.6g + 37.5g^2 - 6.4g^3. Set m'(g) = 0 and solve for g to find the critical points within the interval [0, 4].
Evaluate the function m(g) at the critical points and endpoints to determine the behavior of the function. This will help in understanding how the mileage changes as the amount of gas changes.
Plot the calculated points and sketch the graph of m(g) over the interval [0, 4]. Interpret the graph by analyzing how the mileage varies with the amount of gas, noting any points where the mileage is maximized or minimized.

Risposta video verificata per un problema simile:

Questa soluzione video è stata consigliata dai nostri tutor come utile per risolvere questo problema.
Durata del video:
2m

Concetti chiave

Ecco i concetti essenziali che devi comprendere per rispondere correttamente alla domanda.

Function Analysis

Function analysis involves studying the properties and behaviors of mathematical functions. In this context, understanding the mileage function m(g) is crucial, as it describes how mileage varies with the amount of gas g. Analyzing this function includes determining its domain, range, and key features such as intercepts and turning points.
Video consigliato:
Percorso guidato
06:29
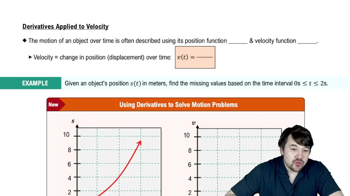
Derivatives Applied To Velocity

Graphing Techniques

Graphing techniques are essential for visually representing mathematical functions. For the mileage function m(g), creating a graph allows for the interpretation of how mileage changes with varying gas levels. This includes plotting points, identifying the shape of the graph, and recognizing trends such as increases or decreases in mileage.
Video consigliato:
Percorso guidato
06:15
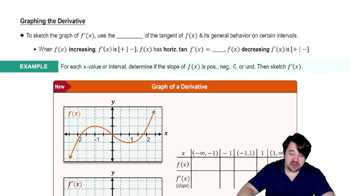
Graphing The Derivative

Critical Points and Interpretation

Critical points are values of g where the function's derivative is zero or undefined, indicating potential maxima, minima, or points of inflection. In the context of the mileage function, finding these points helps in understanding the optimal gas levels for maximum mileage. Interpreting these points provides insights into fuel efficiency and driving strategies.
Video consigliato:
04:50
Critical Points