Explain the Mean Value Theorem with a sketch.
Ch. 4 - Applications of the Derivative
Briggs3rd EditionCalculus: Early TranscendentalsISBN: 9780136847243Non è quello che usi tu?Cambia libro di testo
Capitolo 4, Problema 4.4.26
Graphing functions Use the guidelines of this section to make a complete graph of f.
f(x) = x³ - 147x + 286
Guida verificata passo dopo passo1
Identify the critical points of the function by finding the derivative of f(x) = x³ - 147x + 286. Set the derivative equal to zero to find the critical points.
Calculate the derivative: f'(x) = 3x² - 147. Set this equal to zero and solve for x to find the critical points: 3x² - 147 = 0.
Solve the equation 3x² - 147 = 0 for x. This will give you the x-values of the critical points.
Determine the nature of each critical point by using the second derivative test. Calculate the second derivative: f''(x) = 6x, and evaluate it at each critical point.
Analyze the behavior of the function as x approaches positive and negative infinity to understand the end behavior of the graph. This will help in sketching the complete graph of the function.

Risposta video verificata per un problema simile:
Questa soluzione video è stata consigliata dai nostri tutor come utile per risolvere questo problema.
Durata del video:
10mConcetti chiave
Ecco i concetti essenziali che devi comprendere per rispondere correttamente alla domanda.
Polynomial Functions
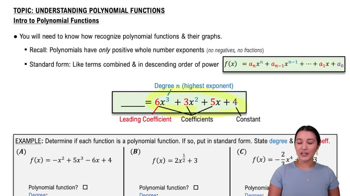
A polynomial function is a mathematical expression involving a sum of powers in one or more variables multiplied by coefficients. The function f(x) = x³ - 147x + 286 is a cubic polynomial, characterized by its highest degree of 3. Understanding the general shape and behavior of polynomial functions is essential for graphing them accurately.
Video consigliato:
Introduction to Polynomial Functions
Critical Points and Extrema
Critical points occur where the derivative of a function is zero or undefined, indicating potential local maxima, minima, or points of inflection. To find these points for f(x), we need to compute its derivative, set it to zero, and solve for x. Analyzing these points helps in determining the overall shape and turning behavior of the graph.
Video consigliato:
Critical Points
End Behavior of Functions
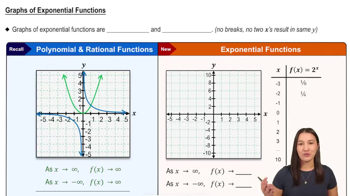
End behavior describes how a function behaves as the input values approach positive or negative infinity. For cubic functions like f(x), the end behavior is determined by the leading term, which in this case is x³. As x approaches infinity, f(x) also approaches infinity, and as x approaches negative infinity, f(x) approaches negative infinity, shaping the overall graph.
Video consigliato:
Graphs of Exponential Functions
Pratica correlata
Domanda del libro di testo
280
views
Domanda del libro di testo
17–83. Limits Evaluate the following limits. Use l’Hôpital’s Rule when it is convenient and applicable.
lim_z→∞ (1 + 10/z²)ᶻ²
265
views
Domanda del libro di testo
Particular antiderivatives For the following functions f, find the antiderivative F that satisfies the given condition.
f(v) = sec v tan v; F(0) = 2, -π/2 < v < π/2
60
views
Domanda del libro di testo
Designer functions Sketch the graph of a function f that is continuous on (-∞,∞) and satisfies the following sets of conditions.
f'(x) > 0, for all x in the domain of f'; f'(-2) and f'(1) do not exist; f"(0) = 0
204
views
Domanda del libro di testo
Locating critical points Find the critical points of the following functions. Assume a is a nonzero constant.
ƒ(x) = x² √(x + 5)
211
views
Domanda del libro di testo
Graphing functions Use the guidelines of this section to make a complete graph of f.
f(x) = x² - 6x
309
views