Ch. 6 - Applications of Integration
Briggs - Calculus: Early Transcendentals 3rd Edition
Briggs3rd EditionCalculus: Early TranscendentalsISBN: 9780136847243Non è quello che usi tu?Cambia libro di testo
Capitolo 6, Problema 6.1.7a

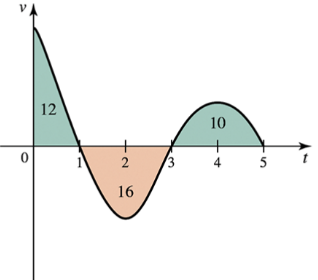
Displacement and distance from velocity Consider the graph shown in the figure, which gives the velocity of an object moving along a line. Assume time is measured in hours and distance is measured in miles. The areas of three regions bounded by the velocity curve and the t-axis are also given.
img
a. On what intervals is the object moving in the positive direction?

Guida verificata passo dopo passo
1
Understand that the velocity graph shows how the velocity of the object changes over time, with the horizontal axis representing time (t) in hours and the vertical axis representing velocity (v) in miles per hour.
Recall that when the velocity is positive (above the t-axis), the object is moving in the positive direction, and when the velocity is negative (below the t-axis), the object is moving in the negative direction.
Identify the intervals on the time axis where the velocity curve is above the t-axis. From the graph, the velocity is positive from t = 0 to t = 1 and from t = 3 to t = 5.
Note that between t = 1 and t = 3, the velocity is negative (below the t-axis), so the object is moving in the negative direction during this interval.
Conclude that the object is moving in the positive direction on the intervals where the velocity is positive, which are t in [0, 1] and t in [3, 5].

Risposta video verificata per un problema simile:

Questa soluzione video è stata consigliata dai nostri tutor come utile per risolvere questo problema.
Durata del video:
1m

Concetti chiave

Ecco i concetti essenziali che devi comprendere per rispondere correttamente alla domanda.

Velocity and Direction of Motion

Velocity indicates both the speed and direction of an object's movement. When velocity is positive, the object moves in the positive direction along the line; when velocity is negative, the object moves in the opposite direction. Understanding the sign of velocity helps determine intervals of motion direction.
Video consigliato:
Percorso guidato
06:29
Derivatives Applied To Velocity

Area Under the Velocity Curve

The area between the velocity curve and the time-axis represents the displacement over a time interval. Positive areas correspond to movement in the positive direction, while negative areas correspond to movement in the negative direction. These areas help quantify how far and in which direction the object has moved.
Video consigliato:
Percorso guidato
05:59
Estimating the Area Under a Curve with Right Endpoints & Midpoint

Intervals of Time and Sign Changes

The velocity graph crosses the time-axis at points where velocity changes sign, indicating a change in direction. Identifying these points allows us to determine intervals where the velocity is positive or negative, which directly relates to the object's direction of motion.
Video consigliato:
Percorso guidato
06:35
Changing Geometries
Pratica correlata
Domanda del libro di testo

Consider the following curves on the given intervals.  


a. Write the integral that gives the area of the surface generated when the curve is revolved about the given axis. 


y=tan x , for 0≤x≤π/4; about the x-axis 

100
views

Domanda del libro di testo

Explain why or why not Determine whether the following statements are true and give an explanation or counterexample.

a. When using the shell method, the axis of the cylindrical shells is parallel to the axis of revolution.

53
views
Domanda del libro di testo

Bike race Theo and Sasha start at the same place on a straight road, riding bikes with the following velocities (measured in mi/hr). Assume t is measured in hours.

Theo: vT(t)=10, for t≥0

Sasha: vS(t)=15t, for 0≤t≤1, and vS(t)=15, for t>1


a. Graph the velocity function for both riders. 

28
views
Domanda del libro di testo

21–30. {Use of Tech} Arc length by calculator


a. Write and simplify the integral that gives the arc length of the following curves on the given interval. 

y = cos 2x, for 0 ≤ x ≤ π

64
views
Domanda del libro di testo

Calculating work for different springs Calculate the work required to stretch the following springs 1.25 m from their equilibrium positions. Assume Hooke’s law is obeyed.

a. A spring that requires 100 J of work to be stretched 0.5 m from its equilibrium position

71
views
Domanda del libro di testo

21–30. {Use of Tech} Arc length by calculator


a. Write and simplify the integral that gives the arc length of the following curves on the given interval. 

y = ln x, for 1≤x≤4

39
views