Ch. 1 - Functions
Hass - Thomas' Calculus 15th Edition
Hass15th EditionThomas' CalculusISBN: 9780137616077Non è quello che usi tu?Cambia libro di testo
Capitolo 1, Problema 1.4.33

Use graphing software to graph the functions specified in Exercises 31–36.
Select a viewing window that reveals the key features of the function.


Graph four periods of the function f (x) = −tan 2x.

Guida verificata passo dopo passo
1
Step 1: Understand the function f(x) = -tan(2x). The tangent function is periodic, and its key features include vertical asymptotes, zeros, and the general shape of the curve. The negative sign flips the graph vertically, and the factor 2 inside the argument compresses the period of the tangent function.
Step 2: Determine the period of the function. The standard period of tan(x) is π, but the factor 2 inside the argument modifies the period. The new period is calculated as π divided by the coefficient of x inside the tangent function, which is 2. Therefore, the period of f(x) = -tan(2x) is π/2.
Step 3: Identify the key features of the function within one period. These include vertical asymptotes at x = -π/4 and x = π/4 (where the tangent function is undefined), zeros at x = 0, and the general shape of the curve flipping due to the negative sign.
Step 4: Set up a viewing window that displays four periods of the function. Since the period is π/2, four periods span a total width of 2π. Choose a viewing window for x from -π to π to capture four periods. For the y-axis, select a range that accommodates the steep slopes near the asymptotes, such as y from -10 to 10.
Step 5: Use graphing software to plot the function f(x) = -tan(2x) within the chosen viewing window. Ensure the graph displays the vertical asymptotes, zeros, and the flipped shape of the tangent function clearly. Adjust the resolution or zoom if necessary to enhance visibility of the key features.

Risposta video verificata per un problema simile:

Questa soluzione video è stata consigliata dai nostri tutor come utile per risolvere questo problema.
Durata del video:
6m

Concetti chiave

Ecco i concetti essenziali che devi comprendere per rispondere correttamente alla domanda.

Graphing Functions

Graphing functions involves plotting points on a coordinate system to visualize the relationship between the input (x-values) and output (y-values) of a function. Understanding how to graph functions, particularly trigonometric ones like tangent, is essential for identifying their behavior, such as periodicity, asymptotes, and intercepts.
Video consigliato:
Percorso guidato
5:53
Graph of Sine and Cosine Function

Periodicity of Functions

Periodicity refers to the repeating nature of certain functions, where the function values repeat at regular intervals. For the tangent function, the period is π, meaning it repeats every π units. Recognizing the period is crucial for accurately graphing multiple cycles of the function, as specified in the question.
Video consigliato:
Percorso guidato
6:22
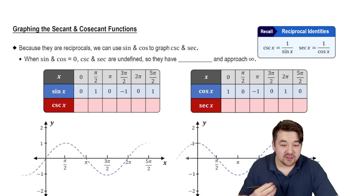
Graphs of Secant and Cosecant Functions

Viewing Windows in Graphing

A viewing window in graphing software defines the range of x and y values displayed on the graph. Selecting an appropriate viewing window is important to capture all key features of the function, such as peaks, troughs, and asymptotes, especially when graphing functions with periodic behavior like f(x) = -tan(2x).
Video consigliato:
13:49
Example 4: Norman Window