Ch. 2 - Limits and Continuity
Hass - Thomas' Calculus 15th Edition
Hass15th EditionThomas' CalculusISBN: 9780137616077Non è quello che usi tu?Cambia libro di testo
Capitolo 2, Problema 2.2.69b

Estimating Limits


[Technology Exercise] You will find a graphing calculator useful for Exercises 67–74.


Let G(x)=(x + 6)/(x² + 4x − 12)


b. Support your conclusions in part (a) by graphing G and using Zoom and Trace to estimate y-values on the graph as x→−6.

Guida verificata passo dopo passo
1
First, identify the function G(x) = (x + 6)/(x² + 4x − 12). Notice that the denominator can be factored to find any points of discontinuity.
Factor the denominator: x² + 4x − 12 = (x + 6)(x − 2). This reveals that the function is undefined at x = -6 and x = 2.
To understand the behavior of G(x) as x approaches -6, simplify the function by canceling the common factor (x + 6) in the numerator and denominator, resulting in G(x) = 1/(x - 2) for x ≠ -6.
Use a graphing calculator to plot the simplified function G(x) = 1/(x - 2). Use the Zoom and Trace features to observe the behavior of the graph as x approaches -6 from both the left and right.
Estimate the y-values on the graph as x approaches -6. Notice the trend in the y-values to support your conclusion about the limit of G(x) as x approaches -6.

Risposta video verificata per un problema simile:

Questa soluzione video è stata consigliata dai nostri tutor come utile per risolvere questo problema.
Durata del video:
1m

Concetti chiave

Ecco i concetti essenziali che devi comprendere per rispondere correttamente alla domanda.

Limits

Limits are fundamental in calculus, representing the value that a function approaches as the input approaches a certain point. Understanding limits is crucial for analyzing the behavior of functions near specific values, especially when direct substitution may lead to indeterminate forms. In this context, we are interested in the limit of G(x) as x approaches -6.
Video consigliato:
05:50
One-Sided Limits

Graphing Functions

Graphing functions involves plotting points on a coordinate system to visualize the behavior of the function. This visual representation helps in understanding how the function behaves as the input changes, particularly near critical points like asymptotes or discontinuities. In this exercise, using a graphing calculator allows for a more precise estimation of y-values as x approaches -6.
Video consigliato:
Percorso guidato
5:53
Graph of Sine and Cosine Function

Zoom and Trace Features

The Zoom and Trace features on a graphing calculator enable users to closely examine specific sections of a graph. Zoom allows for adjusting the viewing window to focus on particular intervals, while Trace lets users move along the graph to read y-values corresponding to x-values. These tools are essential for estimating limits and understanding the function's behavior near the point of interest.
Video consigliato:
05:34
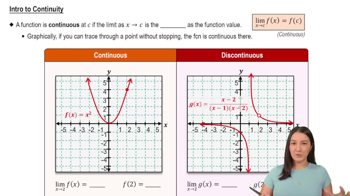
Intro to Continuity