Ch. 3 - Derivatives
Hass - Thomas' Calculus 15th Edition
Hass15th EditionThomas' CalculusISBN: 9780137616077Non è quello che usi tu?Cambia libro di testo
Capitolo 3, Problema 3.2.29

Graphs


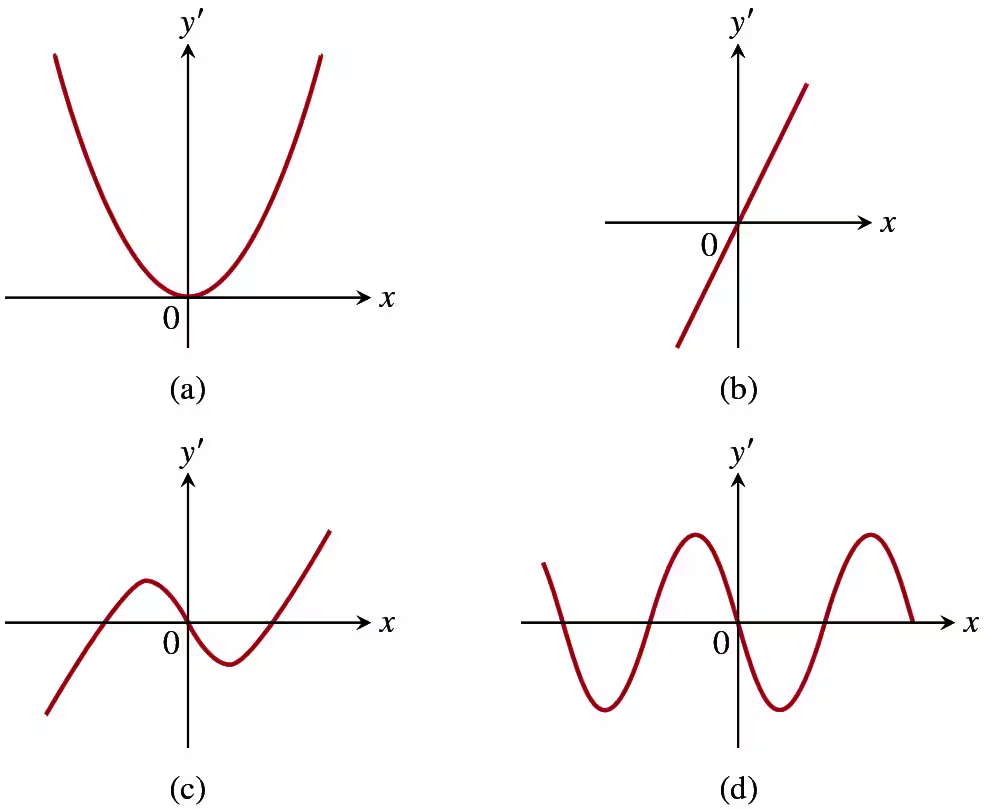
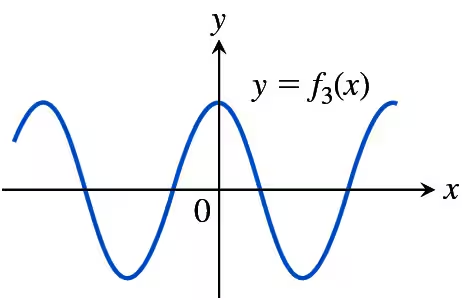
Match the functions graphed in Exercises 27–30 with the derivatives graphed in the accompanying figures (a)–(d).


<IMAGE>
<IMAGE>

Guida verificata passo dopo passo
1
Observe the graph of the function y = f₃(x). It is a sinusoidal wave with alternating peaks and troughs, indicating periodic behavior. The derivative of this function will represent the slope of the tangent line at each point on the curve.
Identify the key features of the graph of y = f₃(x): the slope is zero at the peaks and troughs (where the graph changes direction), and the slope is steepest at the midpoints between peaks and troughs.
Match these features to the derivative graphs (a)–(d). The derivative graph should cross the x-axis at the points where the original function has peaks and troughs (since the slope is zero there). It should also have maximum and minimum values where the original function has the steepest slopes.
Compare the periodicity of the original function to the derivative graphs. The derivative graph should have the same periodicity as the original function, but it may be shifted in phase.
Based on these observations, the derivative graph that matches y = f₃(x) is graph (d), as it exhibits the correct periodicity, zero crossings, and amplitude changes corresponding to the slopes of the original function.

Risposta video verificata per un problema simile:

Questa soluzione video è stata consigliata dai nostri tutor come utile per risolvere questo problema.
Durata del video:
4m

Concetti chiave

Ecco i concetti essenziali che devi comprendere per rispondere correttamente alla domanda.

Derivative and Slope

The derivative of a function at a point is the slope of the tangent line to the graph of the function at that point. It provides information about the rate of change of the function. For example, if the derivative is positive, the function is increasing at that point, while a negative derivative indicates a decreasing function.
Video consigliato:
Percorso guidato
05:13
Slopes of Tangent Lines

Critical Points and Derivative Sign Changes

Critical points occur where the derivative of a function is zero or undefined, indicating potential local maxima, minima, or points of inflection. By analyzing the sign changes of the derivative around these points, one can determine the nature of these critical points, such as whether they are peaks, troughs, or inflection points.
Video consigliato:
04:50
Critical Points

Graphical Interpretation of Derivatives

Graphically, the derivative of a function can be visualized as a new graph that represents the slope of the original function at each point. For instance, a quadratic function's derivative is linear, and a cubic function's derivative is quadratic. Understanding this relationship helps in matching functions with their derivatives by observing the shapes and behaviors of their graphs.
Video consigliato:
01:47
Graphical Applications of Exponential & Logarithmic Derivatives: Example 8