Ch. 4 - Applications of Derivatives
Hass - Thomas' Calculus 15th Edition
Hass15th EditionThomas' CalculusISBN: 9780137616077Non è quello che usi tu?Cambia libro di testo
Capitolo 4, Problema 106b

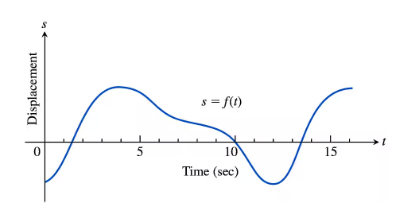
106. Motion Along a Line The graphs in Exercises 105 and 106 show the position s=f(t) of an object moving up and down on a coordinate line. At approximately what times is the (b) velocity equal to zero?
<IMAGE>
pos

Guida verificata passo dopo passo
1
To find when the velocity is zero, we need to identify the points where the derivative of the position function s=f(t) is zero. These points correspond to the local maxima and minima of the graph.
Examine the graph of s=f(t) and look for points where the tangent to the curve is horizontal. These are the points where the slope of the tangent line is zero, indicating that the velocity is zero.
From the graph, observe the peaks and troughs. The velocity is zero at these points because the object changes direction, which occurs at local maxima and minima.
Estimate the time values at these points by looking at the x-axis. For example, if a peak occurs at t=5 seconds, then the velocity is zero at t=5 seconds.
Repeat this process for each peak and trough in the graph to find all the times when the velocity is zero.

Risposta video verificata per un problema simile:

Questa soluzione video è stata consigliata dai nostri tutor come utile per risolvere questo problema.
Durata del video:
4m

Concetti chiave

Ecco i concetti essenziali che devi comprendere per rispondere correttamente alla domanda.

Position Function

The position function, denoted as s = f(t), describes the location of an object along a coordinate line at any given time t. It is a continuous function that can be graphed to visualize the object's motion over time. Understanding this function is crucial for analyzing how the object's position changes, which directly relates to its velocity and acceleration.
Video consigliato:
Percorso guidato
5:20
Relations and Functions

Velocity

Velocity is the rate of change of the position function with respect to time, mathematically represented as v(t) = f'(t). It indicates how fast and in what direction the object is moving. When the velocity is equal to zero, it signifies that the object is momentarily at rest, which can be identified by finding the points where the tangent to the position graph is horizontal.
Video consigliato:
Percorso guidato
06:29
Derivatives Applied To Velocity

Critical Points

Critical points occur where the derivative of a function is zero or undefined, indicating potential local maxima, minima, or points of inflection. In the context of motion, these points are essential for determining when the velocity of the object is zero. Analyzing critical points helps in understanding the object's behavior, such as when it changes direction or comes to a stop.
Video consigliato:
04:50
Critical Points
Pratica correlata
Domanda del libro di testo

Sketch the graph of a twice-differentiable function y=f(x) that passes through the points (-2,2), (-1,1), (0,0),(1,1), and (2,2) and whose first two derivatives have the following sign patterns.

224
views

Domanda del libro di testo

Graph f(x) = x cos x and its second derivative together for 0 ≤ x ≤ 2pi. Comment on the behavior of the graph of f in relation to the signs and values of f".

251
views
Domanda del libro di testo

In Exercises 121–124, find the inflection points (if any) on the graph of the function and the coordinates of the points on the graph where the function has a local maximum or local minimum value. Then graph the function in a region large enough to show all these points simultaneously. Add to your picture the graphs of the function’s first and second derivatives. How are the values at which these graphs intersect the x-axis related to the graph of the function? In what other ways are the graphs of the derivatives related to the graph of the function?

123. y=(4/5)x^5+16x^2-25

220
views
Domanda del libro di testo

Graph f(x) = 2x^4 -4x^2 + 1 and its first two derivatives together. Comment on the behavior of f in relation to the signs and values of f' and f".

134
views
Domanda del libro di testo

103. A function f(x) has domain (-2, 2). The graph below is a plot of the derivative of f, not a plot of f itself. In other words, this is a graph of y = f'(x). Either use this graph to determine on which intervals the graph of f is concave up and on which intervals the graph of f is concave down, or explain why this information cannot be determined from the graph.

256
views
Domanda del libro di testo

Each of Exercises 89–92 shows the graphs of the first and second derivatives of a function y=f(x). Copy the picture and add to it a sketch of the approximate graph of f, given that the graph passes through the point P.

225
views