Ch. 4 - Applications of Derivatives
Hass - Thomas' Calculus 15th Edition
Hass15th EditionThomas' CalculusISBN: 9780137616077Non è quello che usi tu?Cambia libro di testo
Capitolo 4, Problema 4.1.65

Theory and Examples


[Technology Exercise] Graph the functions in Exercises 63–66. Then find the extreme values of the function on the interval and say where they occur.


h(x) = |x + 2| − |x − 3|, −∞ < x < ∞

Guida verificata passo dopo passo
1
Step 1: Understand the function h(x) = |x + 2| − |x − 3|. This function involves absolute values, which can be split into piecewise functions based on the critical points where the expressions inside the absolute values change sign.
Step 2: Identify the critical points for the absolute value expressions. The critical points are x = -2 and x = 3, where the expressions inside the absolute values change sign.
Step 3: Break down the function into piecewise components based on the critical points. For x < -2, both expressions are negative, for -2 ≤ x < 3, the first expression is non-negative and the second is negative, and for x ≥ 3, both expressions are non-negative.
Step 4: Graph the piecewise function by evaluating h(x) in each interval: x < -2, -2 ≤ x < 3, and x ≥ 3. This will help visualize the behavior of the function across the entire domain.
Step 5: Determine the extreme values by analyzing the graph and evaluating the function at the critical points and endpoints of the intervals. The extreme values occur where the function reaches its maximum or minimum values within the given domain.

Risposta video verificata per un problema simile:

Questa soluzione video è stata consigliata dai nostri tutor come utile per risolvere questo problema.
Durata del video:
5m

Concetti chiave

Ecco i concetti essenziali che devi comprendere per rispondere correttamente alla domanda.

Absolute Value Functions

Absolute value functions, such as |x + 2| and |x - 3|, measure the distance of a number from zero on the number line, always yielding a non-negative result. These functions create V-shaped graphs and are crucial for understanding how the function h(x) = |x + 2| − |x − 3| behaves, especially at points where the expressions inside the absolute values change sign.
Video consigliato:
Percorso guidato
06:37
Average Value of a Function

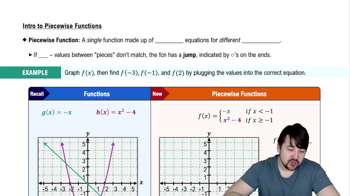
Graphing Piecewise Functions

Graphing piecewise functions involves plotting different expressions over specified intervals. For h(x) = |x + 2| − |x − 3|, the function can be broken into segments based on the critical points where x + 2 = 0 and x - 3 = 0. Understanding how to graph these segments helps visualize the function's behavior and identify extreme values.
Video consigliato:
Percorso guidato
05:36
Piecewise Functions

Finding Extreme Values

Extreme values of a function are its maximum and minimum values within a given interval. To find these for h(x), analyze the critical points where the derivative is zero or undefined, and evaluate the function at these points and endpoints of the interval. This process helps determine where the function reaches its highest or lowest values.
Video consigliato:
05:12
Finding Global Extrema (Extreme Value Theorem)