 Indietro
College Algebra: Functions and Models - Section 1.1
 3:43
3:43
Termini in questo insieme (20)
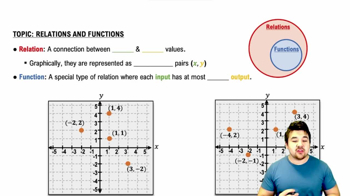
A function is a relation where each input has exactly one output.
The domain is the set of all possible input values for a function.
The range is the set of all possible output values of a function.
The input is the independent variable (usually x), and the output is the dependent variable (usually y).
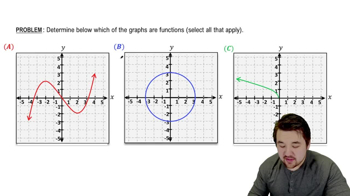
A graph is a function if every vertical line intersects the graph at most once (Vertical Line Test).
The domain is all real numbers except 0 because division by zero is undefined.
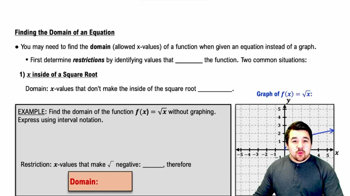
The domain is \(x \geq -5\) because the expression under the square root must be non-negative.
A scatter plot is a graph that shows points representing pairs of data values.
\(f(x)\) denotes the output value of the function f at input x.
A mathematical model is a mathematical representation of a real-world situation using functions or equations.
The independent variable is the input variable that you choose freely, often denoted as x.
The dependent variable depends on the independent variable and is often denoted as y.
If each input value corresponds to exactly one output value, the table defines a function.
Yes, because each day (input) has exactly one weight (output), even if weights repeat on different days.
The domain is all real numbers, \((-\infty, \infty)\).
Yes, because each day has exactly one temperature value.
In the 10th year since 2000 (i.e., 2010), the average cost of a new car was \$26,000.
It means at least one input corresponds to more than one output.
Treat P as the input (independent variable) and x as the output (dependent variable).
\(t=25\) because 2025 is 25 years after 2000.